Excel 2019 or Office 365

Excel 2019 or Office 365: Intellisoft Comparison
Microsoft Office 2019 or Office 365

With Microsoft releasing new versions every 3 years, you may be wondering if you need to upgrade, and to what version. Many people are confused if they should buy Microsoft Office 2019 or Microsoft Office 365.

Here we list a few considerations that will help you choose the correct version of Office

The main difference between Microsoft Office 2019 and Office 365 is a cosmetic one – it’s about the license.

  • Microsoft Office 2019 is a perpetual license. You pay for it once, and then you use it forever. You don’t have to pay for it again.
  • Microsoft Office 365 is a subscription product. You have to pay a subscription fee monthly or annually to use it.

Now you may be thinking, pay once and use it forever is a better choice. Right?

But wait till you check out the pros and cons of a perpetual license of Microsoft Office 2019.

Benefits of Microsoft Office 365 Over Excel 2019

Office 365 Applications

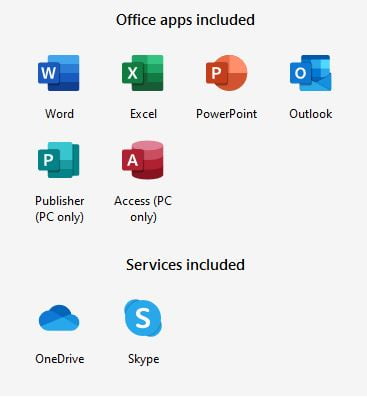
Microsoft Office 365 is purchased directly online, from Microsoft. And the product receives continuous updates, new functions, features, charts, formulas etc. on a monthly basis.

In the beginning, both Microsoft Office 2019 and Office 365 are similar but give it a few months, and you will see new functions emerge in Office 365 that are not going to be there in Office 2019.

Microsoft has already released a fantastic function called XLOOKUP, which is only available if you subscribe to Office 365. This is a much better function than the most used VLOOKUP. With XLookup you can look up anything, from any column, left or right of the searched value, and this new function does EXACT match by default.

I would say that this function alone is sufficient to consider buying a subscription to Microsoft Office 365. And you get to install your Office 365 on 5 different devices, and you can share the same license with 5 other family members. Isn’t it amazing.

Plus, everyone gets 1TB worth of space on OneDrive – Microsoft’s Cloud storage solution.

Online Connection For Office 365?

And contrary to popular belief, you DO NOT NEED to be connected always to the Internet to use Office 365. You just need to connect to the Internet during the initial download and setup, and to sync your OneDrive or license for updates. There is no need to be online every time you have to use  Office. Because Office 365 Home can be used offline. You only need an Internet access when installing and activating your office.

Our Recommendation for Office 365 or Microsoft Excel 2019

We would recommend that you choose a Subscription model Microsoft Office 365. It will be updated regularly, you get to share it, and the 1TB cloud storage is more than what Google Drive or Google Photos etc. give you for storing all your photos or documents.

Office 365 Training in Singapore

Once you have the software installed, make sure you learn the new functions & features of Excel added, so you can make the most of your Office 365 license. You can attend Office 365 Training in Singapore at Intellisoft Systems. We conduct training classes for Excel, Word, PowerPoint for Microsoft Office 2019 and Office 365.

You can join our public classes at Fortune Centre in Singapore, or if you have a group of people, we can conduct training at your office also.

Just contact us at training@intellisoft.com.sg for any training on Office 365 in Singapore.

Cheers,
Vinai Prakash

P.S: Check this out if you are wondering Why learn Microsoft Excel?

Why Learn Python For Data Analysis: An Eye Opener

Learn Python for Data Analysis at Intellisoft Singapore

Python Popularity

Python - Number 1 Programming Language
Python – Number 1 Programming Language

Wondering Why Learn Python?

The workplace has already changed. As technology continues to rapidly transform industries & jobs, staying relevant & competitive requires continuously updating, diversifying, and building completely new skill sets.

Today, Data analysis is no longer the job of IT folks. Everyone is required to analyze the past, adapt to change, and forecast the future. The ability to do so well is increasingly what will keep your job.

Learn Python & Stay Relevant

Python is a great programming language for data science and general data analysis. It is open-source & free to download for anyone, unlike commercial tools like SAS or SPSS. Find out why you must learn Python for your current & future jobs.

Purpose of Learning Python

It is suitable for almost any data science task, from data manipulation and automation to ad-hoc analysis and exploring datasets.

Python is easy to learn, even for complete beginners. You don’t need a background in IT or computer science.

Python Training in Singapore is available for you to get started asap.

Who Uses Python & Why You Should Learn it?

Python is used by people that want to go deeper into data analysis or apply statistical techniques, and by most people who turn to data science.

Python is a production-ready language, meaning it has the capacity to be a single tool that integrates with every part of your workflow!

Why Learn Python Programming
Why You Must Learn Python Programming To Stay Ahead

Why Learn Python: It’s Usability is Great

Whether you work in Manufacturing, Services, Banking, Finance, Logistics, Telecom, Marine, Oil & Gas, Shipping, IT or any other industry, you’ll be able to apply Python to everyday work. And people with a software or engineering background may find Python comes more naturally to them.

  • Coding and debugging is way easier than other programming languages because of the simple syntax of Python
  • Python has a robust ecosystem and is commonly considered one of the easier programming languages to read and learn. Its programming syntax is simple and its commands mimic the English language.
  • Python code is syntactically clear and elegant, easily interpretable, and easy to type.
  • It’s great for building data science pipelines and machine learning products integrated with web frameworks at scale.

Why Learn Python: It’s a Flexible Language

Python is flexible for creating something that has never been done before.

You can also use it for scripting websites, Clean or Scrape Web Data, Merge data from multiple sources, and create games & other applications easily.

Why Learn Python: It is Extremely Easy To Learn

Python’s focus on readability and simplicity means its learning curve is relatively linear and smooth. With this, you can see the difference as you begin to learn Python. Once you know the basics of Python, you should go for Python For Data Analysis Training in Singapore

Python is considered a good language for beginners. No wonder it is the Number 1 Programming language in the world.

Python Programming Training Singapore

Advantages of Python Over Other Languages

  1. General-purpose programming languages are useful beyond just data analysis.
  2. Python has gained popularity for its code readability, speed, and many other functionalities too.
  3. It is great for mathematical computation & learning how algorithms work.
  4. Python has high ease of deployment and reproducibility.

Popular Libraries and Packages

  • pandas to easily manipulate data
  • SciPy and NumPy for scientific computing
  • Scikit-learn for machine learning
  • Matplotlib and seaborn to make graphics & charts
  • statsmodels to explore data, estimate statistical models, and perform statistical tests and unit tests

Getting Started in Python

There are many Python IDEs to choose from which drastically reduce the overhead of organizing code, output, and notes files.

Jupyter Notebooks and Spyder are 2 such popular IDE that we use to teach Python at Intellisoft.

Learn Python Step-By-Step: Instructor Led Training

The best approach to get initiated with using Python is to go for our Step by Step, Beginner Course to introduce the Python Language to you.

With an experienced and knowledgeable instructor, you can learn faster. Our fantastic trainers are ready to explain simple to complex topics with ease. It will be a much better experience.

Plus, attending training will significantly reduce the learning curve, and you will thank yourself for having a quick and rapid start to learning the world’s most popular language – Python.

Contact Us for our Python Training Programs.

Call +65-6250-3575 or email training@intellisoft.com.sg for a Python course brochure.

Article Written By: Vinai Prakash, Intellisoft Systems

Power BI Tip #6: Fixing The Vertical Axis in Power BI Visualisations

Learn to Find The Y-Axis in Power BI at Intellisoft Singapore

Power BI Visualizations are amazing.

The charts and dashboard created in Power BI make it easy for end-users to slice and dice it, visualize the data in any way.

While this is great, some care is needed on the part of the Power BI Dashboard Designers, to make sure that the data is understood in the correct way, and does not lead to any confusion or miscommunication due to the lack of presentation oversight.

Take control of Power BI Charts by manually configuring the Power BI visualizations, and gain more power.

Automatic scaling can mislead people into assuming that the data is all good, and may not yield clear comparison.

In Power BI Charts & Reports, the Vertical axis scales automatically, based on the current slicers, current data and filtered context.

To get more control over the axis, watch this important video tutorial on Power BI, and learn to fix the Y-axis to your advantage.

Tutorial Presented by

Vinai Prakash, Founder & Master Trainer at Intellisoft Systems, Singapore.

For more tips on Power BI, head over to our YouTube Channel, and subscribe to it, to be notified of latest videos and tutorials.

Recommended Reading:

Learn Power BI From Practicing Professionals in Singapore

Intellisoft Systems conducts PowerBI training in Singapore each month. Do attend our hands-on practical training to learn Power BI from the beginning, and be able to analyze and visualize data easily with Microsoft tools.

Visit PowerBI Training in Singapore or email to training@intellisoft.com.sg for a course brochure.

Written & Presented by: Vinai Prakash, PMP, ACTA, ITIL, GAP, MBA

Vinai conducts the Microsoft Power BI training in Singapore. His Power BI courses are extremely popular, fun and easy to learn for beginners and experienced professionals alike.

Join Vinai in his next Power BI training course at Intellisoft. Hundreds of Power BI beginners, power analysts and super users have attended the training and benefited. You could be the next superhero with Power BI training!

Article Written by Vinai Prakash, MBA, PMP, GAP, ACTA Certified

Additional Resources for Power BI

Training Courses

Data Analytics & Visualization with Power BI

Learn Microsoft Power BI Suite For Better Data Analysis & Reporting

Power BI Tips, Tricks & Video Tutorials

Power BI Tip #2: Reference Query Results in Another Query With Power Query [Video Tutorial]

Microsoft Power BI: Super Charge Your Data Analysis Process

Power BI Tip #6: Fixing The Vertical Axis in Power BI Visualisations

Power BI Tip #5: All About Slicer Controls in Power BI

Power BI Tip#4: Enter Data Into Power BI Quickly [Video]

Power BI Tip #3: Quick Formatting of Power BI Visuals

Power BI Tip #5: All About Slicer Controls in Power BI

Learn Slicer Control in Power BI at Intellisoft Singapore

Slicers are really the key feature in Power BI, that make the Dashboards & Visualizations come alive. They add a bit of interactivity in the dashboards and allow the users to select, slice and dice the information in different ways and methods.

With a slicer, you can choose any available year, and the entire report can be filtered to that particular year, or month, or product category, fiscal period, department or division.

Slicers can be created using Checkboxes, Radio buttons, Flat Chicklet style buttons and can be formatted to allow a single, multiple or all value pick.

Since there are a plethora of features, I decided to record a short Power BI tutorial highlighting the key features of Slicers in Power BI.

Hope you will benefit from these features and will be able to build some interactivity in your Power BI dashboards.

Hope you found this tip useful.

For more tips on Power BI, head over to our YouTube Channel, and subscribe to it, to be notified of latest videos and tutorials.

Recommended Reading:

For tips on loading data from the result set of another query, you can use the Reference feature of Power Query

Power BI shows only rows where data is found. If you want to see all rows, you’ve got to see this tip on Showing Rows With No Matching Rows.

Learn Power BI From Practicing Professionals in Singapore

Intellisoft Systems conducts PowerBI training in Singapore each month. Do attend our hands-on practical training to learn Power BI from the beginning, and be able to analyze and visualize data easily with Microsoft tools.

Visit PowerBI Training in Singapore or email to training@intellisoft.com.sg for a course brochure.

Written & Presented by: Vinai Prakash,
Founder & Master Trainer, Intellisoft Systems

Vinai conducts the Microsoft Power BI training in Singapore. His Power BI courses are extremely popular, fun and easy to learn for beginners and experienced professionals alike.

Join Vinai in his next Power BI training course at Intellisoft. You won’t regret it!

Power BI Tip#4: Enter Data Into Power BI Quickly [Video]

Learn to Enter Data in Power BI Fast with Intellisoft Singapore

Even though Power BI makes it extremely easy to load data from Excel and hundreds of other sources, clean it, and process it in any way, there are times when I wanted to do some testing, and bring in some test data.

I didn’t want to create Excel files and store them. I only wanted a simple way to bring in the data into Power BI.

Finally, I saw that Microsoft Power BI has actually thought about such a need, and there is a prominent button called Enter Data right on the Home screen.

I tested it out, and to my amazement, it worked perfectly. So I have been using it heavily in my work as a Power BI consultant, and architect of Power BI dashboards for our clients. Most importantly, this is one feature that our participants really loved in our Power BI classroom training.

So I recorded a short tutorial on how to use this nifty Enter Data feature of Power BI for your viewing pleasure, and for you to begin using it in your work.

Hope you found this tip useful.

For more tips on Power BI, head over to our YouTube Channel, and subscribe to it, to be notified of latest videos and tutorials.

Recommended Reading:

For tips on loading data from the result set of another query, you can use the Reference feature of Power Query

Power BI shows only rows where data is found. If you want to see all rows, you’ve got to see this tip on Showing Rows With No Matching Rows.

Learn Power BI From Practicing Professionals in Singapore

Intellisoft Systems conducts PowerBI training in Singapore each month. Do attend our hands-on practical training to learn Power BI from the beginning, and be able to analyze and visualize data easily with Microsoft tools.

Visit PowerBI Training in Singapore or email to training@intellisoft.com.sg for a course brochure.

Written & Presented by: Vinai Prakash,
Founder & Master Trainer, Intellisoft Systems

Vinai conducts the Microsoft Power BI training in Singapore. His Power BI courses are extremely popular, fun and easy to learn for beginners and experienced professionals alike.

Join Vinai in his next Power BI training course at Intellisoft. You won’t regret it!

Power BI Tip #3: Quick Formatting of Power BI Visuals

Learn to Format Visuals in Power BI at Intellisoft Singapore

The default fonts in Power BI are quite small, and there is no global setting to set the font sizes in Power BI.

For every new visual you create in the Power BI dashboard, you need to change the sizes manually. This is quite painful and frustrating at times.

Here is a quick way to format Power BI Visuals – Watch this short tutorial to help you save time while formatting in Power BI.

Presented by: Vinai Prakash,
Founder: Intellisoft Systems & ExcelChamp.Net
Visit https://www.intellisoft.com.sg for indepth, practical, hands-on classroom training on Power BI in Singapore with master trainer Vinai.

Article Written by Vinai Prakash, MBA, PMP, GAP, ACTA Certified

Additional Resources for Power BI

Training Courses

Data Analytics & Visualization with Power BI

Learn Microsoft Power BI Suite For Better Data Analysis & Reporting

Power BI Tips, Tricks & Video Tutorials

Power BI Tip #2: Reference Query Results in Another Query With Power Query [Video Tutorial]

Microsoft Power BI: Super Charge Your Data Analysis Process

Power BI Tip #6: Fixing The Vertical Axis in Power BI Visualisations

Power BI Tip #5: All About Slicer Controls in Power BI

Power BI Tip#4: Enter Data Into Power BI Quickly [Video]

Power BI Tip #3: Quick Formatting of Power BI Visuals

Free Tips, Tutorials & Training Grants Info

Learn from expert tips, tricks and resources for Excel, PowerPoint, Photoshop, Python, Power BI, Project Management, IT, Soft Skills & more with our Email Newsletter.
Plus get the latest news on Grants. Join Today!

Found What You Were
Looking For?

Just Tell us...

We're Here To Help You!