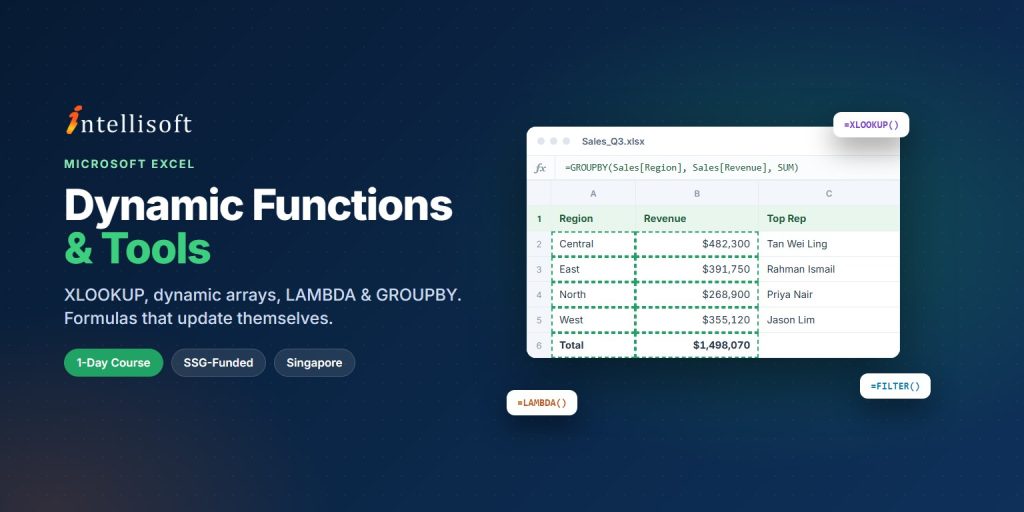
Most Excel users still rely on VLOOKUP, manual filtering and copy-paste summaries that break whenever the data changes. This 1-day Excel dynamic functions course teaches the modern analytical functions in Microsoft 365 Excel so you can extract patterns and insights from data with formulas that update themselves.
You will work with dynamic arrays and spill behaviour, using FILTER, SORT, SORTBY and UNIQUE to build outputs that refresh automatically as the source data changes. You will then use XLOOKUP and XMATCH to retrieve and cross-reference data across multiple sources more reliably than VLOOKUP or INDEX-MATCH, and apply SUMIFS, COUNTIFS, AVERAGEIFS, LET, LAMBDA, GROUPBY and PIVOTBY to build dynamic summary views.
The emphasis is on interpretation, not just mechanics. Through project-based scenarios on real business datasets, you will choose the right function for each analytical question, validate the result and present the insight clearly.
Designed for beginner to intermediate learners who work with data and want to move beyond basic formulas — administrators, business analysts, finance and operations professionals, reporting analysts and project managers.
Stop rebuilding reports by hand — build Excel formulas that update themselves and turn raw data into answers.
🖥️
Learn By Doing
Hands-on exercises on real Singapore business datasets from the very first module.
👥
Small Class Sizes
10–25 participants for personal attention.
📧
Post-Training Support
We provide email support for our participants. Simply email us your questions.
What You'll Walk Away With
🔎
Replace VLOOKUP with XLOOKUP and XMATCH for faster, more reliable lookups across datasets.
⚡
Build reports with FILTER, SORT and UNIQUE that update automatically when data changes.
🧮
Summarise data in one formula with GROUPBY, PIVOTBY, LET and LAMBDA.
📈
Work on real business datasets and turn results into clear, decision-ready insights.