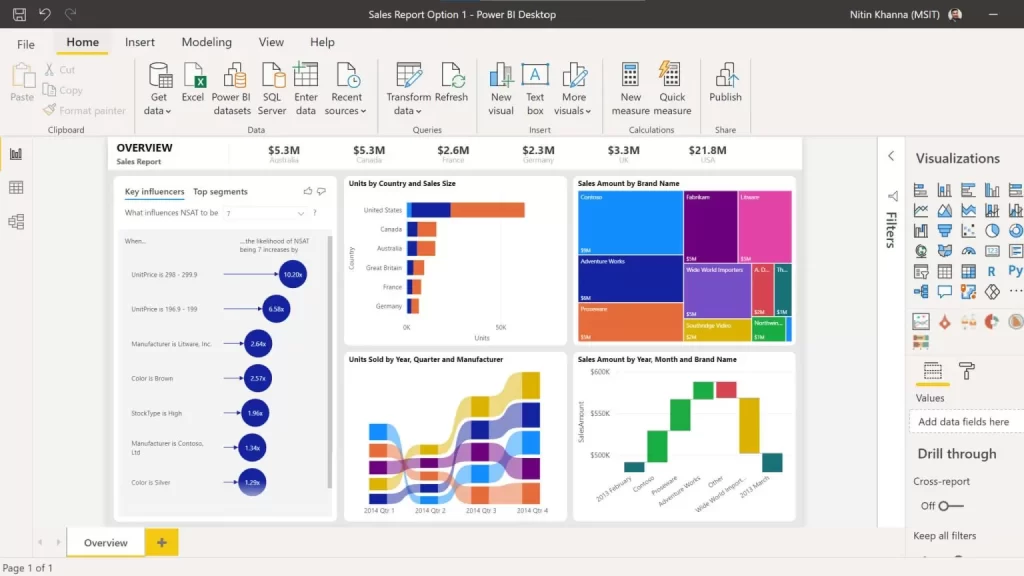
The main objective of this WSQ Funded SkillsFuture Course on Power BI is to learn how to analyze and visualize data using the Microsoft Power BI Tool easily.
Data Analytics and Visualization With Power BI course helps to make you understand the Power BI suite of products available from Microsoft and be a Power Ninja in analyzing, visualizing & understanding Business Intelligence Reporting with Microsoft Power BI Courses.
- Understand Power Query to load data from any source and cleanse it
- Learn to Create DAX Measures, and how to apply them to your job.
- Achieve better and faster results than with existing Microsoft tools.
- Produce valuable KPI metrics for your business that never existed before.
- Learn the best tips & tricks to solve complex problems & create stunning work.
Logistics
This 2 Day Power BI Data Analytics and Data Visualization Training Course will be held in Singapore. Tea/Coffee, Light Snacks are provided in this training at Fortune Centre, 190 Middle Road. We are located near Rochor, Bencoolen, Bras Basah & Bugis MRT Stations.
UTAP Funding: NTUC Members can utilize UTAP to offset 50% of the remaining fees and learn Power BI at Intellisoft Systems in Singapore*.
Learn Power BI With the Best Power BI Trainer in Singapore: Mr. Vinai Prakash
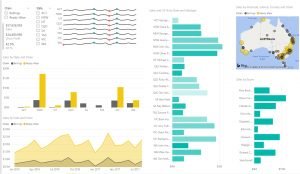
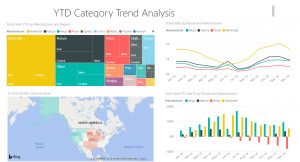
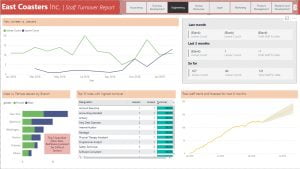
Learn Power BI and visualize data to gain insights into your data immediately. Present data in charts and dashboards over the Power BI service, offering auto-refresh on a daily or hourly basis.
Corporate Power BI Trainings in Singapore
Corporate training available for 15 or more participants — conducted at your premises or ours. Contact us for a
tailored proposal. We have conducted several Corporate Training Workshops on Microsoft Power BI at MSD, MasterCard, Rolls Royce, NUH, GSK, Shell, NIIT, Manulife, SIA, Sony, SP Power, Samsung, Vodafone and several other government and private organizations in Singapore, Malaysia, Indonesia, Australia, Egypt, Zimbabwe etc.
The Public & Corporate Training workshops have been very well received, and we are the top provider of Corporate Trainers for Power BI, Python, Tableau, SQL, Advanced Excel, Power Point, Power Apps, Power Automate etc. in Singapore.