Power Query and Power Pivot in Excel Course at Intellisoft Singapore
Power Query is a feature in Excel that allows you to quickly import data from multiple sources and easily clean, transform, and reshape it to suit your needs.
We show you how to use this powerful, time-saving tool to do deep cleansing of data, and then do a deeper analysis of data with Microsoft Excel’s Power Pivot.
This course teaches you how to import, merge, rearrange, and clean data, as well as how to repeat the process with one click if the data changes.
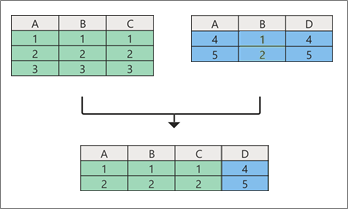
Discover how to split columns, unpivot data, and use joins to merge, segment, and compare datasets.
Data Analysis Expressions (DAX) allow Microsoft Excel users to create powerful calculated fields in Power Pivot. In this course, you will learn how to use the DAX language and Power Pivot to explore and analyze relational data models. You will master how to add calculated columns and measures to data models in Excel.
We highlight the differences between calculated columns and DAX measures, covers common DAX formulas and functions, and discusses best practices for working with DAX and Power Pivot.
Full of dozens of tips, tricks & techniques in this comprehensive, practical, hands-on training using Power Query and Power Pivot in Excel for Deep Data Analysis.
Master Power Query and Power Pivot to clean messy data, build smarter models, and generate deeper Excel insights faster.
🖥️
Learn By Doing
Hands-on exercises on real Singapore business datasets from the very first module.
👥
Small Class Sizes
Capped at 15 participants for personal attention.
📧
Post-Training Support
If you need any help after attending the course, we offer email support to our participants.
What You'll Walk Away With
⚡Learn to import, clean, reshape, and refresh data from multiple sources with Power Query.
📊Build deeper Excel analysis using Power Pivot, relational data models, calculated columns, and DAX measures.
🧩Use joins, unpivoting, grouping, and custom transformations to prepare complex business datasets efficiently.
🛠️Gain practical skills through hands-on exercises, case studies, and real-world Excel reporting scenarios.
What You Will Learn
Learning Outcomes of Power Query Course
📥
Import Data from Multiple Sources
Bring Excel, CSV, SQL, web, and other datasets into Power Query efficiently.
🧹
Clean and Transform Data Efficiently
Remove errors, replace values, split columns, and reshape data for accurate analysis.
🔗
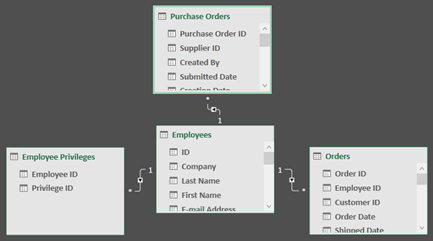
Build Relationships Across Tables
Create connected Excel data models for deeper analysis with Power Pivot.
🧮
Create Calculations Using DAX
Develop calculated columns and measures using core DAX syntax and functions.
📈
Analyse Complex Relational Datasets
Use Power Pivot to explore trends, comparisons, and business insights across linked tables.
🎛️
Design Interactive Excel Dashboards
Create slicers, filters, KPIs, and visual reports for dynamic decision-making.
🚀
Optimize Models for Better Performance
Apply best practices to reduce file size, improve structure, and tune query performance.
The “Power Query & Power Pivot for Deep Analysis with Excel” course is designed to equip participants with advanced skills in data manipulation, analysis, and visualization using Excel’s powerful tools, Power Query and Power Pivot.
Participants will start by mastering Power Query, learning how to import data from various sources, clean and transform it efficiently. Moving into Power Pivot, they will delve into data modeling techniques, establishing relationships between tables, and creating calculated columns and measures using DAX expressions.
Throughout the course, emphasis will be placed on practical applications through hands-on exercises and real-world case studies, enabling participants to analyze complex datasets, generate insightful visualizations, and optimize performance for large-scale data scenarios.
By the end of the course, participants will have the tools and knowledge to confidently handle diverse data challenges, automate workflows, and enhance decision-making processes using Excel as a robust analytical platform.
Is This For You?
Who Should Attend Power Query Course Singapore?
📊
Data Analyst
You spend too much time cleaning messy Excel data before analysis can even begin.
📉
Financial Analyst
You need faster, more accurate ways to model, forecast, and consolidate reporting data.
📋
BI Professional
You want stronger data modeling and dashboard preparation skills inside Excel.
💼
IT Consultant
You need better methods to manage data workflows, relationships, and reporting for users.
The target audience for the “Power Query & Power Pivot for Deep Analysis with Excel” course includes professionals and individuals who work extensively with data in Excel and wish to deepen their analytical capabilities. This course is ideal for:
Data Analysts: Professionals who analyze and interpret data regularly and want to leverage advanced Excel tools for more efficient and insightful analysis.
Business Intelligence Professionals: Individuals involved in creating reports, dashboards, and data visualizations who seek to enhance their skills in data modeling and manipulation.
Financial Analysts: Those responsible for financial modeling, forecasting, and budgeting who want to streamline data handling and improve accuracy in their analyses.
Excel Power Users: Individuals already proficient in Excel who want to expand their toolkit with Power Query and Power Pivot for more sophisticated data transformations and analysis.
Managers and Decision-Makers: Leaders who rely on data-driven insights to make informed decisions and wish to improve their ability to extract and present meaningful insights from data.
IT Professionals and Consultants: Those tasked with managing and optimizing data workflows within organizations who want to leverage Excel’s capabilities for enhanced data management and reporting.
Overall, the course is suitable for anyone looking to advance their Excel skills specifically for data analysis, whether in business, finance, consulting, or other fields where data-driven decision-making is critical.
Before You Attend
Pre-Requisites for Power Query & Power Pivot for Deep Analysis with Excel
To join the “Power Query & Power Pivot for Deep Analysis with Excel” course, participants should ideally have the following prerequisites:
Proficiency in Excel: Participants should be familiar with basic to intermediate Excel functionalities, including navigating through worksheets & using simple formulas and functions.
Understanding of Data Concepts: A basic understanding of fundamental data concepts such as tables, rows, columns, and data types is recommended.
Familiarity with Data Analysis: Some experience in data analysis tasks like sorting, filtering, and basic data manipulation within Excel will be beneficial.
Motivation to Learn: An eagerness to explore advanced data manipulation techniques and a willingness to engage in hands-on exercises and case studies throughout the course.
These prerequisites will ensure that participants can effectively engage with the course content, grasp advanced concepts in Power Query and Power Pivot, and apply their knowledge to real-world data analysis challenges using Excel.
🏛️ WSQ-funded course with SkillsFuture support; pay from S$390.
Curriculum
Power Query Course Singapore: Course Outline & Curriculum
Module 1
Introduction to Power Query
Role of Power Query
Power Query interface navigation
Business use cases
Excel vs Power BI
Module 2
Data Transformation Basics
Import Excel CSV SQL Web
Remove errors replace values
Reorder columns and rows
Split and merge columns
Module 3
Advanced Data Transformation
Advanced filtering techniques
Custom columns with logic
Fill Down and Fill Up
Grouping and aggregating data
Module 4
Introduction to M Language
M syntax and structure
Advanced Editor query editing
Custom functions
Table.TransformColumns and Text.Combine
Module 5
Case Studies and Practical Exercises
Sales data reporting scenario
Combine files and folders
Practice with datasets
Common data challenges discussion
Module 1
Introduction to Power Pivot
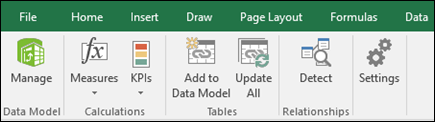
Power Pivot activation setup
Load data into model
One-to-one one-to-many relationships
Create hierarchies
Module 2
DAX Fundamentals
DAX syntax and functions
Row context vs filter context
Calculated columns and measures
SUM AVERAGE COUNT DISTINCTCOUNT
Module 3
Advanced DAX Techniques
YTD QTD MTD rolling averages
SWITCH IFERROR CALCULATE
SUMX and AVERAGEX
Debug DAX errors
Module 4
Optimizing Data Models
Star and snowflake schemas
Reduce file size duplicates
Diagram View relationships
Query performance tuning
Module 5
Advanced Analytics and Reporting
Slicers and dashboard filters
Power Pivot visual reports
KPIs and business metrics
Integrate Query and Pivot
Module 6
Final Project and Review
Build dashboard from raw data
Solve business problems
Key takeaways and best practices
Power Query & Power Pivot for Deep Analysis with Excel
Course Outline
Day 1: Power Query Essentials and Intermediate Techniques
Module 1: Introduction to Power Query
Understanding the Role of Power Query in Data Preparation
Navigating the Power Query Interface
Key Use Cases of Power Query in Business Scenarios
Differences Between Power Query in Excel and Power BI
Module 2: Data Transformation Basics
Importing Data from Various Sources (Excel, CSV, SQL, Web, etc.)
Data Cleaning Techniques: Removing Errors, Replacing Values
Reordering Columns and Rows for Analysis
Splitting and Merging Columns
Module 3: Advanced Data Transformation
Advanced Filtering Techniques for Targeted Data Extraction
Creating Custom Columns with Conditional Logic
Using the Fill Down and Fill Up Features for Missing Data
Advanced Grouping and Aggregating Techniques for Summarized Data
Module 4: Introduction to M Language
Exploring the M Language Syntax and Structure
Editing Queries Directly in the Advanced Editor
Creating Custom Functions for Reusable Logic
Common M Functions for Data Manipulation (e.g., Table.TransformColumns, Text.Combine)
Module 5: Case Studies and Practical Exercises
Real-World Scenario: Preparing Sales Data for Reporting
Combining Data from Multiple Files and Folders
Practice Exercises with Provided Datasets
Group Discussion on Common Data Challenges
Day 2: Power Pivot and Advanced Analytics
Module 6: Introduction to Power Pivot
Overview of the Power Pivot Add-in: Activation and Setup
Understanding the Importance of Star and Snowflake Schemas
Best Practices for Efficient Data Models: Reducing File Size, Avoiding Duplicates
Using the Diagram View for Relationship Management
Performance Tuning: Analyzing and Optimizing Query Performance
Module 10: Advanced Analytics and Reporting
Creating Slicers and Filters for Interactive Dashboards
Designing Effective Power Pivot Reports with Visual Insights
Using KPIs to Track and Display Key Business Metrics
Integrating Power Query and Power Pivot for Dynamic Reporting
Module 11: Final Project and Review
Hands-On Project: Building an Interactive Dashboard from Raw Data
Applying Power Query and Power Pivot to Solve Business Problems
Course Recap: Key Takeaways and Best Practices
These objectives aim to provide participants with a comprehensive understanding and practical skills in leveraging Power Query and Power Pivot for deep data analysis within Excel, preparing them to handle complex data challenges effectively.
Trusted by professionals from 500+ organisations
Training Course Fees & Funding
Full course fee: S$1,000.00
(before GST & government funding)
TGS: TGS-2024049574
Foreigners & other pass holders: Government grants are not applicable. Full course fee of S$1,000.00 + 9% GST = S$1,090.00 applies. Contact us for more details.
* Terms & conditions apply. Funding subject to eligibility and approval by respective agencies. GST applies on full course fee before subsidy. Fee information is accurate as of Jun 2026.
Register
Register for Power Query Course Singapore in Singapore
What Past Power Query Course Singapore Participants Say
★★★★
This course helped me finally understand how Power Query and Power Pivot fit together in real work. I now clean source files faster, build more reliable data models, and use DAX measures with much more confidence.
Placeholder testimonial: I joined to improve our monthly Excel reporting process and came away with techniques I could apply immediately. Power Query automation, data transformation, and Power Pivot modeling saved us a lot of manual effort.
S
Shanti Nair
Reporting Manager, AIA Singapore
★★★★★
Placeholder testimonial: The hands-on exercises were very practical and closely matched the reporting issues I face at work. The sections on merging datasets, relationships, and DAX calculations were especially useful for building stronger Excel dashboards.
A
Adrian Lim
Business Analyst, DB Schenker Singapore
★★★★
Learned how the data can be cleansed and easier to analyze quickly. Maymond gave a very detailed and clear lecture. Most importantly, it was interesting and easy to understand.
C
Czarina Uichanco
Senior Associate, DBS
★★★★
I most enjoyed the Linkage between Power Pivot to Power BI, Difference between SQL tables, Excel and PowerBI & Cost and interface difference between Power BI and Tableau, which explains why most government agencies and SMEs adopt the use of Power BI instead
T
Tommy Chen
Manager
Common Questions
Frequently Asked Questions
What is the course fee and what grants are available? ▾
The full course fee is S$1,000 before GST and government funding. Eligible participants may receive 50% or 70% SSG funding, with fees starting from S$390 after WSQ grant support. SkillsFuture Credit, UTAP, and SFEC options are also referenced on the course page, subject to eligibility and approval.
How long is the Power Query and Power Pivot course? ▾
This is a 2-day instructor-led training course. It covers both Power Query and Power Pivot in a structured format, moving from data preparation to data modeling and DAX analysis. The course is designed to be practical and hands-on throughout both days.
Are there any prerequisites for joining this course? ▾
Yes. Participants should already be comfortable with basic to intermediate Excel features such as worksheets, simple formulas, and common data handling tasks. A basic understanding of tables, rows, columns, data types, sorting, filtering, and data manipulation will help you benefit fully from the course.
Will I receive a certificate after completing the course? ▾
Yes. The course page states that a WSQ Certificate is issued. As with most funded WSQ courses, participants should expect attendance and any required assessment components to be completed in order to qualify.
Where is the training conducted, and is online training available? ▾
The listed venue is Fortune Centre, 190 Middle Road, #10-08, Singapore 188979. The public schedule shown on the page is for classroom training at this Singapore venue. If you need a corporate run or alternative arrangement, it is best to enquire directly with Intellisoft.
Who should attend this Power Query and Power Pivot course? ▾
This course is suited for data analysts, business intelligence professionals, financial analysts, Excel power users, managers, decision-makers, IT professionals, and consultants. It is especially useful for people who work extensively with data in Excel and want stronger skills in data preparation, modeling, and analysis. It is a strong fit for professionals who need deeper Excel-based reporting and decision support.
How do I register for the course? ▾
You can register using the available class dates shown on the course page. The page also includes a corporate or group enquiry option if you are arranging training for a team. If you are unsure about funding or eligibility, Intellisoft indicates that they can guide you through the application process.
What will I learn in this course? ▾
You will learn how to import, clean, transform, and combine data using Power Query, then build deeper analysis using Power Pivot and DAX. The training also covers table relationships, calculated columns, measures, KPIs, slicers, and dashboard-style reporting. It is designed to help you handle complex data challenges more efficiently in Excel.
Power Query & Power Pivot for Deep Analysis with Excel
Enter your details and we'll send the full course brochure — complete outline, funding details, and registration instructions.
✅ Brochure on its way — check your inbox!
Free Tips, Tutorials & Training Grants Info
Learn from expert tips, tricks and resources for Excel, PowerPoint, Photoshop, Python, Power BI, Project Management, IT, Soft Skills & more with our Email Newsletter. Plus get the latest news on Grants. Join Today!