This Power BI Course introduces the exciting world of business analytics to you.
In the Microsoft Power BI class nearby in Singapore, you will learn the skills to be the best business analyst and gain insights into your data quickly. You will be able to efficiently use Power BI, Write DAX Measures and Use Power Query to clean and load data.
In this Power BI training Singapore, you will also learn Power BI – how to publish the final dashboards and reports to the Microsoft Power BI Service in the cloud and refresh data automatically.
The course starts first by highlighting the critical Advanced Excel functionality useful for data analysis.
Then moves to Power BI tools – Power Query, Power Pivot & Power BI – all built into Power BI Desktop training to help you visualize and analyze information quickly and efficiently.
Learn Power BI Data Analysis & Visualization MasterClass Training:
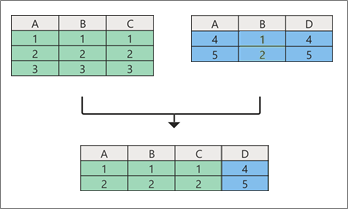
- Importing and creating relationships between tables of data.
- Understanding the optimal data structure to use in PowerBI.
- Writing basic Data Analysis eXpressions (DAX) formulas to extract business insights.
- Then write more advanced DAX formulas that use the power of DAX to extract additional business insights from the data that are not immediately obvious (yet are inherently available).
- An introduction and overview of Power Query. It covers How to use the tool to load data and cleanse it automatically in the future with fantastic Power Query.
- Helping Excel professionals move from being an average user of Excel to being a Power BI analyst, covering the differences between the tools and how to start using Power BI Dashboards effectively.
Day One: Data Visualization Fundamentals With Microsoft Power BI
Introduction
- When and Why to Use Power BI
- Tour of the Power BI Environment
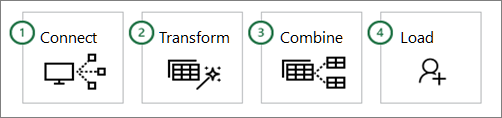
Loading Data from Hundreds of Data Sources
- Various Methods of Data Loading with Power Query
- Tradeoffs in Loading Techniques
- Best Practices of Loading & Cleaning Data in Power Query, a built-in tool within Microsoft Power BI.
- Create a Data Model of Multiple Tables within Power BI
Introduction to Formulas and DAX using Microsoft Power BI
- Named reference syntax
- Similarities to traditional Excel
- Measures (Calc Fields) vs. Calc Columns
- COUNTROWS() and DISTINTCOUNT()
- Best practices of using Aggregator & Iterator Functions in Power BI Measure creation
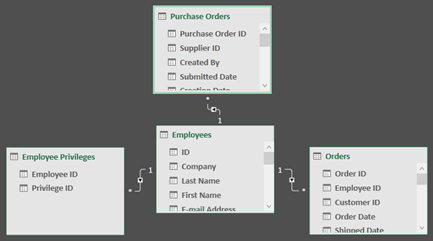
Working with Multiple Tables using Power BI
- Relationships: the End of VLOOKUP?
- Data Tables vs. Lookup Tables
- Multiple Data tables in a single model
- Troubleshooting your “relationship problems”
- Exercises to cement your learning
The Magic of DAX Measures in Microsoft Power BI
- The CALCULATE() function.
- ALL(), percentage of totals, and “cancelling slicers.
- Introduction to Time Intelligence: Date/Calendar Tables
- Running totals – Year to Date,
- Change versus Prior Month/Year Etc.
What-if Analysis using Disconnected Tables and Slicers
Day Two: Advanced Data Visualization With Power BI 
Recap and More DAX
- Recap of previous day
- Theory of the Vertipaq engine
- Filter() , Custom Calendars.
DAX Patterns for common problems using Power BI
- Counting things that didn’t happen (eg customers without purchases)
- Custom time intelligence patterns
Power Query
- When to use it and why
- Built-in transformations
- The “M” language
- Using Power Query to solve real-world problems.
Performance
- How to Keep Your Files Small and Your Calculations Fast
- The theory behind compression Sharing and Refreshing Workbooks
- Different Web Hosting options (SharePoint and Power BI)
- Options to refresh workbooks easily
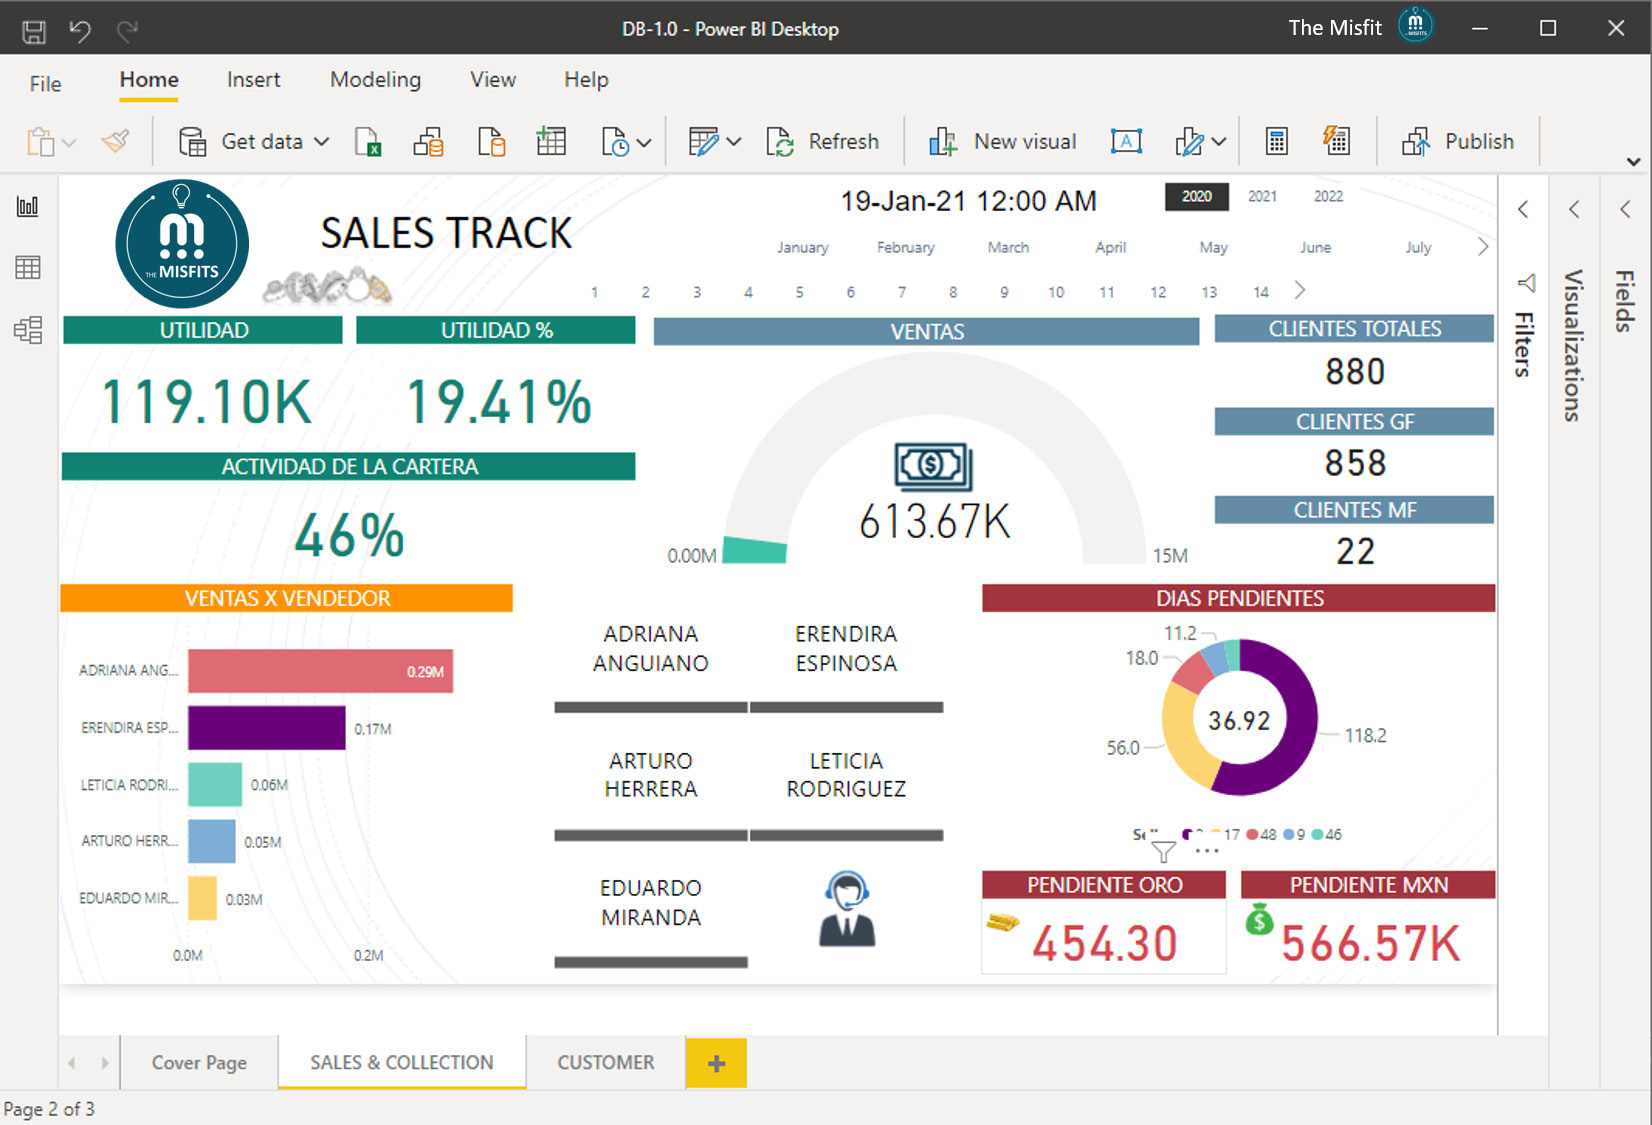
- Creating Advanced Reports and Dashboards with Power BI
Advanced Power BI Visualizations
- A detailed review of what is different about Power BI vs Excel.
- Learn to think differently and use the visualizations available.
Publishing Dashboards to Power BI Services
- A detailed review of the cloud offering, including sharing, Q&A, Analyze in Excel, and publishing Dashboards to Mobile Apps.
- Using Power BI Mobile
Microsoft’s Best Kept Secret Unveiled
- Cube Formulas
General Q&A
This Power BI MasterClass Workshop has been rated the Best Power BI Training Course in Singapore by several of our participants, Companies and HRs.
Use this class to learn Power BI and get your entire team to master Power BI data visualizations, DAX, Power Query & online report publishing.
Intellisoft offers comprehensive Power BI training courses in Singapore to help individuals acquire Power BI certification Singapore. This Best Power BI course Singapore Skillsfuture program covers essential skills such as data visualization, dashboard creation, and data analysis.
Participants can expect hands-on training and practical exercises to enhance their understanding of Power BI tools and techniques. Enroll in WSQ Funded & SkillsFuture enabled Power BI courses Singapore today to master the art of visualizing data with PowerBI dashboards.
The main objective of this WSQ Funded SkillsFuture Course on Power BI is to learn how to analyze and visualize data using the Microsoft Power BI Tool easily.
Data Analytics and Visualization With Power BI course helps to make you understand the Power BI suite of products available from Microsoft and be a Power Ninja in analyzing, visualizing & understanding Business Intelligence Reporting with Microsoft Power BI Courses.
- Understand Power Query to load data from any source and cleanse it
- Learn to Create DAX Measures, and how to apply them to your job.
- Achieve better and faster results than with existing Microsoft tools.
- Produce valuable KPI metrics for your business that never existed before.
- Learn the best tips & tricks to solve complex problems & create stunning work.
Logistics
This 2 Day Power BI Data Analytics and Data Visualization Training Course will be held in Singapore. Tea/Coffee, Light Snacks are provided in this training at Fortune Centre, 190 Middle Road. We are located near Rochor, Bencoolen, Bras Basah & Bugis MRT Stations.
UTAP Funding: NTUC Members can utilize UTAP to offset 50% of the remaining fees and learn Power BI at Intellisoft Systems in Singapore*.
Learn Power BI With the Best Power BI Trainer in Singapore: Mr. Vinai Prakash
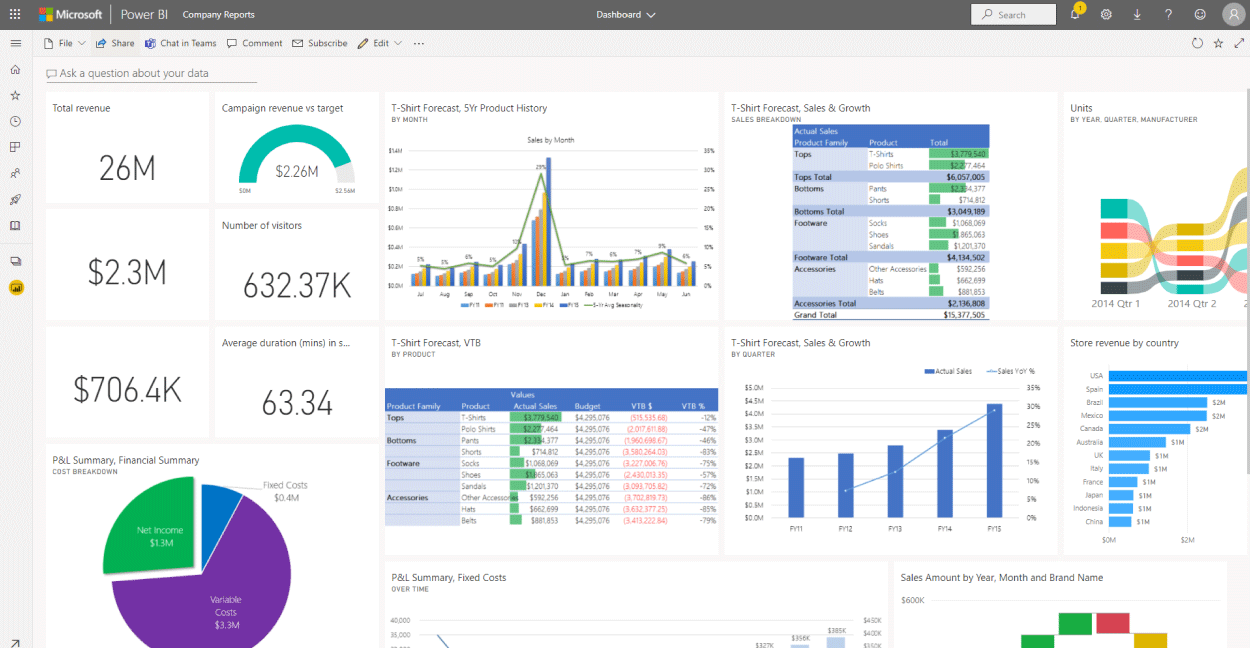
Learn Power BI and visualize data to gain insights into your data immediately. Present data in charts and dashboards over the Power BI service, offering auto-refresh on a daily or hourly basis.
Corporate Power BI Trainings in Singapore
Corporate training available for 15 or more participants — conducted at your premises or ours. Contact us for a
tailored proposal. We have conducted several Corporate Training Workshops on Microsoft Power BI at MSD, MasterCard, Rolls Royce, NUH, GSK, Shell, NIIT, Manulife, SIA, Sony, SP Power, Samsung, Vodafone and several other government and private organizations in Singapore, Malaysia, Indonesia, Australia, Egypt, Zimbabwe etc.
The Public & Corporate Training workshops have been very well received, and we are the top provider of Corporate Trainers for Power BI, Python, Tableau, SQL, Advanced Excel, Power Point, Power Apps, Power Automate etc. in Singapore.
It would be good if you have Basic knowledge of Excel, and can write simple formulas like SUM, IF, Nested IF, and:
- Light usage of Excel PivotTables (or similar data analysis tools)
- Familiarity with Excel functions like SUMIF and VLOOKUP are a plus
- A passion for acquiring Data Analysis & Data Visualization Superpowers
Note: Anyone with Database, BI, Programming, or similar experience is quite qualified to take this course, even if lacking in good Excel experience.
Interested in mastering Power BI in Singapore?
Beginners can easily learn Power BI and create data visualizations easily.
In this Microsoft Power BI course Singapore, we teach complete beginners. This Data Visualization With Power BI Training is suitable for beginners. It is better if you have some decent experience in using Excel on a day to day basis.
- Intensive users of Excel, especially those responsible for reporting and analysis.
- This training is useful for Bankers, Finance, and Accounting Executives who deal with a large amount of data and can change it into actionable form.
- Data analysts can use it to derive complex performance analyses for actions to be taken.
- Business users also use it to observe changes in data patterns to understand the performance of their investments in marketing, sales, and advertising.
- Organizations looking to leverage
Microsoft’s groundbreaking Power Pivot & BI offerings. - Business Intelligence and Database professionals looking to increase their professional agility and dramatically expand their capabilities.
The Excel Data Analysis training complements this course, if you use Excel for data analysis & Dashboard creation.
Post-Course Support
- We provide free consultation related to the subject matter after the course.
- Please email your queries to training@intellisoft.com.sg and we will forward your queries to the subject matter experts.
Venue:
All courses are conducted at Intellisoft Training Rooms at 190 Middle Road, 10-08 Fortune Centre, Singapore 188979.
Short walk from Bencoolen MRT, Bugis, Rochor, Bras Basah MRT stations. The venue is disabled-friendly. For directions, click Contact Us.
The main objective of this WSQ Funded SkillsFuture Course on Power BI is to learn how to analyze and visualize data using the Microsoft Power BI Tool easily.
Data Analytics and Visualization With Power BI course helps to make you understand the Power BI suite of products available from Microsoft and be a Power Ninja in analyzing, visualizing & understanding Business Intelligence Reporting with Microsoft Power BI Courses.
- Understand Power Query to load data from any source and cleanse it
- Learn to Create DAX Measures, and how to apply them to your job.
- Achieve better and faster results than with existing Microsoft tools.
- Produce valuable KPI metrics for your business that never existed before.
- Learn the best tips & tricks to solve complex problems & create stunning work.
Logistics
This 2 Day Power BI Data Analytics and Data Visualization Training Course will be held in Singapore. Tea/Coffee, Light Snacks are provided in this training at Fortune Centre, 190 Middle Road. We are located near Rochor, Bencoolen, Bras Basah & Bugis MRT Stations.
UTAP Funding: NTUC Members can utilize UTAP to offset 50% of the remaining fees and learn Power BI at Intellisoft Systems in Singapore*.
Learn Power BI With the Best Power BI Trainer in Singapore: Mr. Vinai Prakash
Learn Power BI and visualize data to gain insights into your data immediately. Present data in charts and dashboards over the Power BI service, offering auto-refresh on a daily or hourly basis.
Corporate Power BI Trainings in Singapore
Corporate training available for 15 or more participants — conducted at your premises or ours. Contact us for a
tailored proposal. We have conducted several Corporate Training Workshops on Microsoft Power BI at MSD, MasterCard, Rolls Royce, NUH, GSK, Shell, NIIT, Manulife, SIA, Sony, SP Power, Samsung, Vodafone and several other government and private organizations in Singapore, Malaysia, Indonesia, Australia, Egypt, Zimbabwe etc.
The Public & Corporate Training workshops have been very well received, and we are the top provider of Corporate Trainers for Power BI, Python, Tableau, SQL, Advanced Excel, Power Point, Power Apps, Power Automate etc. in Singapore.
Beginners can easily learn Power BI and create data visualizations easily.
In this Microsoft Power BI course Singapore, we teach complete beginners. This Data Visualization With Power BI Training is suitable for beginners. It is better if you have some decent experience in using Excel on a day to day basis.
- Intensive users of Excel, especially those responsible for reporting and analysis.
- This training is useful for Bankers, Finance, and Accounting Executives who deal with a large amount of data and can change it into actionable form.
- Data analysts can use it to derive complex performance analyses for actions to be taken.
- Business users also use it to observe changes in data patterns to understand the performance of their investments in marketing, sales, and advertising.
- Organizations looking to leverage
Microsoft’s groundbreaking Power Pivot & BI offerings. - Business Intelligence and Database professionals looking to increase their professional agility and dramatically expand their capabilities.
The Excel Data Analysis training complements this course, if you use Excel for data analysis & Dashboard creation.
Day One: Data Visualization Fundamentals With Microsoft Power BI
Introduction
- When and Why to Use Power BI
- Tour of the Power BI Environment
Loading Data from Hundreds of Data Sources
- Various Methods of Data Loading with Power Query
- Tradeoffs in Loading Techniques
- Best Practices of Loading & Cleaning Data in Power Query, a built-in tool within Microsoft Power BI.
- Create a Data Model of Multiple Tables within Power BI
Introduction to Formulas and DAX using Microsoft Power BI
- Named reference syntax
- Similarities to traditional Excel
- Measures (Calc Fields) vs. Calc Columns
- COUNTROWS() and DISTINTCOUNT()
- Best practices of using Aggregator & Iterator Functions in Power BI Measure creation
Working with Multiple Tables using Power BI
- Relationships: the End of VLOOKUP?
- Data Tables vs. Lookup Tables
- Multiple Data tables in a single model
- Troubleshooting your “relationship problems”
- Exercises to cement your learning
The Magic of DAX Measures in Microsoft Power BI
- The CALCULATE() function.
- ALL(), percentage of totals, and “cancelling slicers.
- Introduction to Time Intelligence: Date/Calendar Tables
- Running totals – Year to Date,
- Change versus Prior Month/Year Etc.
What-if Analysis using Disconnected Tables and Slicers
Day Two: Advanced Data Visualization With Power BI
Recap and More DAX
- Recap of previous day
- Theory of the Vertipaq engine
- Filter() , Custom Calendars.
DAX Patterns for common problems using Power BI
- Counting things that didn’t happen (eg customers without purchases)
- Custom time intelligence patterns
Power Query
- When to use it and why
- Built-in transformations
- The “M” language
- Using Power Query to solve real-world problems.
Performance
- How to Keep Your Files Small and Your Calculations Fast
- The theory behind compression Sharing and Refreshing Workbooks
- Different Web Hosting options (SharePoint and Power BI)
- Options to refresh workbooks easily
- Creating Advanced Reports and Dashboards with Power BI
Advanced Power BI Visualizations
- A detailed review of what is different about Power BI vs Excel.
- Learn to think differently and use the visualizations available.
Publishing Dashboards to Power BI Services
- A detailed review of the cloud offering, including sharing, Q&A, Analyze in Excel, and publishing Dashboards to Mobile Apps.
- Using Power BI Mobile
Microsoft’s Best Kept Secret Unveiled
- Cube Formulas
General Q&A
This Power BI MasterClass Workshop has been rated the Best Power BI Training Course in Singapore by several of our participants, Companies and HRs.
Use this class to learn Power BI and get your entire team to master Power BI data visualizations, DAX, Power Query & online report publishing.
Intellisoft offers comprehensive Power BI training courses in Singapore to help individuals acquire Power BI certification Singapore. This Best Power BI course Singapore Skillsfuture program covers essential skills such as data visualization, dashboard creation, and data analysis.
Participants can expect hands-on training and practical exercises to enhance their understanding of Power BI tools and techniques. Enroll in WSQ Funded & SkillsFuture enabled Power BI courses Singapore today to master the art of visualizing data with PowerBI dashboards.
It would be good if you have Basic knowledge of Excel, and can write simple formulas like SUM, IF, Nested IF, and:
- Light usage of Excel PivotTables (or similar data analysis tools)
- Familiarity with Excel functions like SUMIF and VLOOKUP are a plus
- A passion for acquiring Data Analysis & Data Visualization Superpowers
Note: Anyone with Database, BI, Programming, or similar experience is quite qualified to take this course, even if lacking in good Excel experience.
Interested in mastering Power BI in Singapore?
Post-Course Support
- We provide free consultation related to the subject matter after the course.
- Please email your queries to training@intellisoft.com.sg and we will forward your queries to the subject matter experts.

Learn By Doing
You learn best when you Do It Yourself.
We teach you, step by step, how you can learn new skills, build your knowledge and enhance your career prospects quickly & easily, with Practical Tips & Tricks!
SkillsFuture Ready
Singaporeans can use $500 SkillsFuture Credits for this training to offset the course fees.
Contact us for advise on how to go about claiming your SkillsFuture.
Get Started Today!

Claim WSQ Grant
Companies sponsoring their staff for training can Claim up to 70% WSQ Funding, subject to SSG Eligibility Criteria.
Applicable for Individual & Company Sponsored Singaporeans/PRs.


 Explore statistical summary