Learn the Best Tricks to Transform Data into Information, and become an Excel Ninja ![]() Advanced Techniques for Using Formulas, Pivot Tables, Charts & Dashboards in Excel in a Sales, Marketing, Accounting or Service Department.
Advanced Techniques for Using Formulas, Pivot Tables, Charts & Dashboards in Excel in a Sales, Marketing, Accounting or Service Department.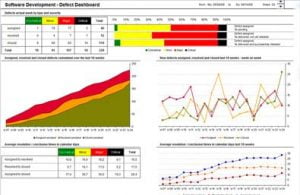
You must have basic knowledge of Microsoft Office 365, Excel 2019, Excel 2016 or Excel 2013.
Two Day Excel Dashboard Training in Singapore – Conducted by Master Trainer Vinai Prakash, MBA, PMP, GAP – noted speaker, author, consultant and founder of Intellisoft.
Vinai has over 35 years of experience in analyzing data and is an expert an Data Mining & Data Analysis using Microsoft Excel and many other business intelligence tools.
SDF Funding is available to Singapore Companies (For company sponsored candidates). Call +65 6250-3575 for Details.
SkillsFuture credits ready for Singaporeans.
UTAP Funding: NTUC Members can utilize UTAP to offset 50% of the remaining fees*.
Click Here to Download The 8 Habits of Highly Effective Data Analysts (An Article Written by Vinai Prakash, published in the Straits Times, Singapore )
Recommended Reading: Creating Management Dashboards in Microsoft Excel
Today, Microsoft Excel has become extremely power tool for any data warrior. Whether you work in Sales, Marketing, Customer Service, Logistics, Accounts, Manufacturing, Finance or Administration, everyone must become an expert at using Microsoft Excel.
Please visit Creating Management Dashboards in Microsoft Excel
Excel Dashboard Training in Singapore – Course Outline:
1. Understanding Management Dashboards
- What is a Dashboard?
- Principles of Great Dashboard Design
2. Using Advanced Formulas & Functions in Excel
- Referencing & Ranges
- Advanced Lookup
- Advanced Formatting
3 Advanced Pivot Table Techniques in Excel
- Percentage
- Computed Columns
- Grouping & Sorting
- Top Views
- Multiple data sources
- Pivot Charts & Visual Dashboarding Techniques
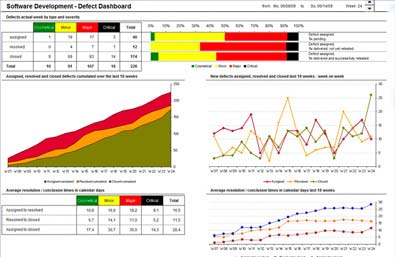
 4 Advanced Power Charting Techniques
- Thermometer Chart
- Doughnut Chart
- Pareto chart
- Versatile management dashboards
5 Creation of Excel Dashboards Using Macros
- Simple & Complex Macros
- Dynamic Dashboards using Macros
6 Creating Dynamic Dashboards with Excel for Management Reporting
- Complete Management Dashboard for Sales & Services
- Best Practices in Dashboard Design
7 Practical Dashboard Creation: Hands-on Dashboard Creation in the Workshop
- Creating a Sales Dashboard
- Creating a Services Dashboard
- Creating a HR Dashboard
Click here to Register for the 2 Day Excel Dashboard MasterClass
PRACTICAL * HANDS-ON * FULL OF EXAMPLES & CASE STUDIES * GREAT VALUE FOR MONEY
Sales, Marketing, Finance, IT Executives, Engineers, Project Managers, Directors, CXOs, Managing Directors, General Managers, and Data Warriors who dabble with data and want to learn advanced techniques to convert Data into actionable Information. 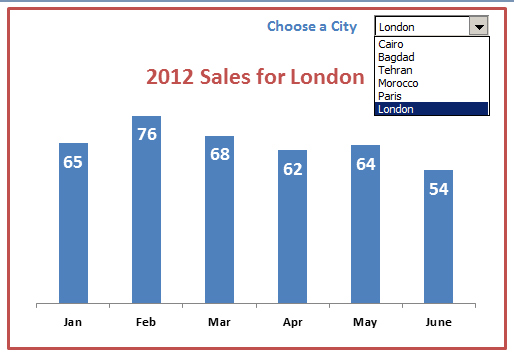
Logistics
This 2 Day Excel Dashboard Training Masterclass will be held in Singapore.
Tea/Coffee, Light Snacks are provided in this training.
You should have knowledge of the basics of using Microsoft Office 365 / Excel 2019 / Excel 2016 / 2013 / 2010 and using simple functions and formulas.
You must know how to cut, copy and paste, do AutoSum and write simple formulas in Excel before you join the Excel Dashboard Training.
To join an Excel Dashboard MasterClass in Singapore, where you’ll learn how to create interactive dashboards using features such as Slicers, Pivot Tables, Drop-downs, and other interactive controls, the following prerequisites may be beneficial:
Basic Excel proficiency: It’s important to have a fundamental understanding of Excel, including knowledge of formulas, functions, data entry, and formatting. Familiarity with common Excel features like cell referencing, data manipulation, and basic calculations will be advantageous.
Laptop and software: Participants will be provided with a laptop in the class. Several participants typically bring their own laptops with the necessary software installed. If you want to use your own laptop, make sure you have a compatible version of Excel, preferably the latest, as some advanced features may not be available in older versions.
Contact us for the specific questions on prerequisites and requirements of the Excel Dashboard MasterClass you are interested in attending in Singapore.
This course is suitable for people with basic experience in using Excel. You should be able to write simple functions and formulas in Excel.
Apple Mac with Excel 2016 or above is supported for this training.
Post-Course Support
- We provide free consultation related to the subject matter after the course.
- Please email your queries to training@intellisoft.com.sg and we will forward your queries to the subject matter experts.
Venue:
All courses are conducted at Intellisoft Training Rooms at 190 Middle Road, 10-08 Fortune Centre, Singapore 188979.
Short walk from Bencoolen MRT, Bugis, Rochor, Bras Basah MRT stations. The venue is disabled-friendly. For directions, click Contact Us.
Sales, Marketing, Finance, IT Executives, Engineers, Project Managers, Directors, CXOs, Managing Directors, General Managers, and Data Warriors who dabble with data and want to learn advanced techniques to convert Data into actionable Information.
Logistics
This 2 Day Excel Dashboard Training Masterclass will be held in Singapore.
Tea/Coffee, Light Snacks are provided in this training.
This course is suitable for people with basic experience in using Excel. You should be able to write simple functions and formulas in Excel.
Apple Mac with Excel 2016 or above is supported for this training.
Excel Dashboard Training in Singapore – Course Outline:
1. Understanding Management Dashboards
- What is a Dashboard?
- Principles of Great Dashboard Design
2. Using Advanced Formulas & Functions in Excel
- Referencing & Ranges
- Advanced Lookup
- Advanced Formatting
3 Advanced Pivot Table Techniques in Excel
- Percentage
- Computed Columns
- Grouping & Sorting
- Top Views
- Multiple data sources
- Pivot Charts & Visual Dashboarding Techniques
4 Advanced Power Charting Techniques
- Thermometer Chart
- Doughnut Chart
- Pareto chart
- Versatile management dashboards
5 Creation of Excel Dashboards Using Macros
- Simple & Complex Macros
- Dynamic Dashboards using Macros
6 Creating Dynamic Dashboards with Excel for Management Reporting
- Complete Management Dashboard for Sales & Services
- Best Practices in Dashboard Design
7 Practical Dashboard Creation: Hands-on Dashboard Creation in the Workshop
- Creating a Sales Dashboard
- Creating a Services Dashboard
- Creating a HR Dashboard
Click here to Register for the 2 Day Excel Dashboard MasterClass
PRACTICAL * HANDS-ON * FULL OF EXAMPLES & CASE STUDIES * GREAT VALUE FOR MONEY
You should have knowledge of the basics of using Microsoft Office 365 / Excel 2019 / Excel 2016 / 2013 / 2010 and using simple functions and formulas.
You must know how to cut, copy and paste, do AutoSum and write simple formulas in Excel before you join the Excel Dashboard Training.
To join an Excel Dashboard MasterClass in Singapore, where you’ll learn how to create interactive dashboards using features such as Slicers, Pivot Tables, Drop-downs, and other interactive controls, the following prerequisites may be beneficial:
Basic Excel proficiency: It’s important to have a fundamental understanding of Excel, including knowledge of formulas, functions, data entry, and formatting. Familiarity with common Excel features like cell referencing, data manipulation, and basic calculations will be advantageous.
Laptop and software: Participants will be provided with a laptop in the class. Several participants typically bring their own laptops with the necessary software installed. If you want to use your own laptop, make sure you have a compatible version of Excel, preferably the latest, as some advanced features may not be available in older versions.
Contact us for the specific questions on prerequisites and requirements of the Excel Dashboard MasterClass you are interested in attending in Singapore.
Post-Course Support
- We provide free consultation related to the subject matter after the course.
- Please email your queries to training@intellisoft.com.sg and we will forward your queries to the subject matter experts.

Claim SDF Grant
Companies sponsoring their staff for training can Claim SDF Funding, subject to SSG Eligibility Criteria.
Applicable for Company Sponsored Singaporeans & PRs.
SkillsFuture Ready
Singaporeans can use $500 SkillsFuture Credits for this training to offset the course fees.
Contact us for advise on how to go about claiming your SkillsFuture.
Get Started Today!

Learn By Doing
You learn best when you Do It Yourself.
We teach you, step by step, how you can learn new skills, build your knowledge and enhance your career prospects quickly & easily, with Practical Tips & Tricks!


Register for Excel Dashboard Training Singapore today by simply clicking on the chosen course date available at the top of this page.
Need Help?

- Call us at +65 6250-3575, SMS / WhatsApp: +65 9066–9991
- Send an email to training@intellisoft.com.sg OR
- Submit an online enquiry if you have any questions regarding Dashboard Masterclass training.
We also offer Corporate Trainings for Excel Dashboard Training Singapore, if you have a group of 12 or more people. We can arrange to conduct the Dashboards training at your office location.