About This Advanced Data Analytics and Data Visualization with Excel Course
WSQ Grant of up to 50-70%
A good visualization tells a story, removing the noise from data and highlighting useful information, curating data into a form easier to understand, and highlighting the trends and outliers.
Advanced Data Analytics and Visualization course using Microsoft Excel, helps build complex models, making it easy to reach meaningful conclusions, and simplifies the decision-making process.
Companies can then use these insights to identify areas to improve upon and factors that influence customer satisfaction and make better predictions for sales and growth.
Data storytelling helps the data feel alive and ensures that the message it’s conveying is meaningful and relevant, by balancing logic and facts with the emotional impact of a story, companies can better engage their audiences and enhance interactions with their customer base during business events.
By the end of this practical business intelligence with Excel course, you will be able to apply advanced data analytics and data visualization techniques to identify underlying trends and patterns in data with Microsoft Excel.
Data Analysis & Visualization training at Intellisoft Singapore
Learning Data Science, Data Visualization & Data Analysis are critical skills in gaining a deeper understanding of your data and making better decisions. They help in analyzing the performance of the business & continuous improvement of processes.
This course covers a number of Statistical Data Analysis Techniques for Predictive Analytics, Data Mining, Advanced Data Visualization Techniques & much more… all using Microsoft Excel. Each method is demonstrated with examples & exercises for your own business analytics.
This is the highest level of Microsoft Excel MasterClass to learn advanced Data visualization & Business Analytics.
Classroom-based lectures with hands-on exercises on analyzing data using Microsoft Excel are used in this workshop to analyze & visualize data and find meaningful information. Data and business analytics provide valuable insights to management.
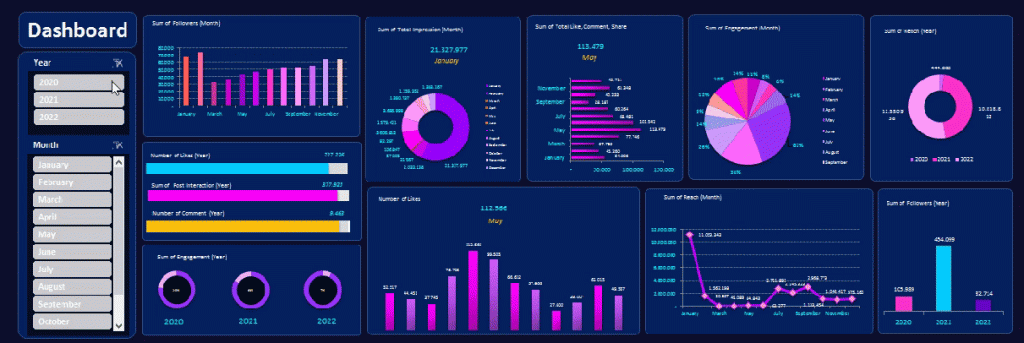
Dynamic Excel Dashboard Sample
Turn raw Excel data into dashboards, forecasts, and business insights that reveal trends, outliers, and stronger decisions.
🖥️
Learn By Doing
Hands-on exercises on real Singapore business datasets from the very first module.
👥
Small Class Sizes
Capped at 25 participants for personal attention.
📧
Post-Training Support
You can send questions by email and the trainer will be able to answer your queries.
What You'll Walk Away With
📊Build dynamic dashboards, charts, and Pivot-based reports that update from changing data selections.
📈Apply forecasting, regression, correlation, and scenario analysis techniques using advanced Excel tools.
🧹Clean, transform, model, and combine data from multiple worksheets for more reliable analysis.
🧠Learn practical business analytics methods that help uncover patterns, trends, and decision-ready insights.
What You Will Learn
What You Will Learn in Advanced Data Analytics and Data Visualization with Excel
🔍
Use Advanced Excel Functions
Use deeper Excel functions for data analysis, data mining, and business analytics tasks.
🧹
Apply Data Cleansing Techniques
Apply practical methods for cleansing, transforming, and modelling data before analysis.
🧪
Implement Sensitivity Analysis Models
Implement Data Tables to test assumptions and compare multiple business scenarios.
🎯
Use Goal Seek Effectively
Use Goal Seek to find missing values and derive actionable business insights.
📉
Design Advanced Excel Visualisations
Design richer visuals using multiple charts, PivotTables, and slicers for reporting.
📐
Build Predictive Regression Models
Build data models and apply linear regression for predictive analysis and forecasting.
📋
Create Business Intelligence Dashboards
Create Excel dashboards for management reporting and insight-driven decision making.
Is This For You?
Who Should Attend This Advanced Excel Analytics Excel Course?
📊
Data Analyst
You need better ways to clean data, spot patterns, and present findings beyond basic spreadsheets.
👔
Business Manager
You struggle to turn large Excel reports into clear dashboards for faster decisions.
🧭
Decision Maker
You need concise visual summaries that highlight trends, outliers, and business drivers quickly.
💼
Excel End User
You use Excel often but still find advanced PivotTables, cleanup, and visualization techniques difficult.
Most data analysts, managers, decision-makers, and even end users typically struggle with report creation as they lack knowledge of features such as data analysis, data cleanup, advanced pivot tables techniques, and visualization techniques within Excel.
With this WSQ course, we target such people and will help such people learn advanced data analytic and data visualization techniques to organize data better and represent the same in both a dynamic tabular and chart format.
After attending this WSQ Advanced Excel Data Analytics & Visualization course, our audience will be better able to:
Organize data within excel in a “normalized” way to create dynamic reports.
Create Pivot tables and charts that provide a dynamic view of data based on slider selections.
Create infographics summaries that are linked to the analyzed data and Pivot tables.
Before You Attend
Pre-Requisites for Advanced Data Analytics and Data Visualization with Excel
It would be great if you have good knowledge of Excel and could write simple formulas like SUM, IF, Create Bar Charts and use Excel on a regular basis for basic analysis and reporting.
Good knowledge and experience in using Excel on a regular basis.
Familiarity with Basic Excel functions is a must.
A passion for acquiring Data Analysis Superpowers.
Note: Anyone with Database, Business Intelligence, IT Programming, or similar experience are pretty qualified to take this course, even if lacking in everyday Excel experience.
Microsoft Excel software is available for download from the Microsoft website as a subscription. We will provide you with a copy of Microsoft Excel for use in the class, on our laptops.
🏛️ Up to 70% WSQ funding plus SkillsFuture Credit support available.
Curriculum
Advanced Data Analytics and Data Visualization with Excel: Course Outline & Curriculum
Module 1
Data Modeling Using Pivot Tables & Pivot Charts
Introduction to Data Modeling
Data Filtering & Transformation
Patterns across multiple data sets
Visual Analysis with Pivot Charts
Module 2
Solver and Scenarios to Manage Multiple Constraints
Managing Multiple Constraints
Proof of concept using Data Solver
Decision Making using Scenarios
Module 3
Data Modeling & Linear Regression for Better Forecasts
Data Modeling Principles
Building a Model With Excel
Using Linear Regression
Module 4
Data Mining and Goal Seek To Derive Business Insights
Data Mining With Lookup Functions
Business Insights From Goal Seek
Advanced Data Mining use cases
Module 5
Statistical Analysis and Data Visualization Dashboards
Key Principles of Data Visualization
Qualitative data-driven visualization
Statistical analysis of data
Advanced Data Analytics & Data Visualization Course With Excel Course Outline
This is a very practical, hands-on, and insightful course, full of advanced Excel techniques to bring in the data, analyze it quickly, identify trends, and visualize the information in charts, graphs and dashboards.
Module 1: Data Modeling Using Pivot Tables & Pivot Charts
Introduction to Data Modeling
Data Filtering & Transformation
Use Pivots to identify patterns across multiple data sets
Visual Analysis with Pivot Charts
Module 2: Solver and Scenarios to Manage Multiple Constraints
Managing Multiple Constraints
Proof of concept using Data Solver
Decision Making using Scenarios
Module 3: Data Modeling & Linear Regression for Better Forecasts
Data Modeling Principles
Building a Model With Excel
Using Linear Regression
Module 4: Data Mining and Goal Seek To Derive Business Insights
Data Mining With Lookup Functions
Business Insights From Goal Seek
Advanced Use Cases for Data Mining With Excel Functions
Module 5: Statistical Analysis and Data Visualization Dashboards
Key Principles of Data Visualization
Presentation of qualitative data-driven visualization
Statistical analysis of data
Learn The Secrets of Data Analysis With Excel Today in Singapore with Excel Advanced formulas course Singapore
Join This Practical Training To Get Ahead With Advanced
Business Data Analysis & Visualization.
Learn The Best Excel Functions & Features for Data Analytics!
Business Data Analytics With Excel Course Trainer:
Advanced Data Analytics and Data Visualization with Excel Training at Intellisoft.
This Excel Data Analysis course is created and delivered by Vinai Prakash, Master Trainer & Founder of Intellisoft Systems.
Vinai has authored several articles on Data Analysis, Excel Dashboarding Techniques, Data Warehousing, Data Mining, Using SQL Databases for Creating Data-Rich applications, published in leading magazines, newspapers & books.
MBAMicrosoft Certified Trainer35+ Years Experience
Founder of Intellisoft Systems. Trained 45,000+ professionals across Singapore corporates, government agencies, and polytechnics, in several countries. Vinai has published articles on data analysis in The Straits Times and written content for leading business publications. He is the author of the bestselling book on Amazon - Excel Crash Course.
Trusted by professionals from 500+ organisations
Training Course Fees & Funding
Full course fee: S$900.00
(before GST & government funding)
TGS: TGS-2022017399
Foreigners & other pass holders: Government grants are not applicable. Full course fee of S$900.00 + 9% GST = S$981.00 applies. Contact us for more details.
* Terms & conditions apply. Funding subject to eligibility and approval by respective agencies. GST applies on full course fee before subsidy. Fee information is accurate as of Apr 2026.
Register
Register for Advanced Data Analytics and Data Visualization with Excel in Singapore
What Past Advanced Data Analytics and Data Visualization with Excel Participants Say
★★★★★
Mr Vinai’s grasp of Excel is outstanding. Useful tips to use Advanced Excel Analytics efficiently & effectively. Real-life examples are used in class. Great effort. All my questions were well answered. Thank you, Mr Vinai!
T
Terrence Tan
MasterCard
★★★★★
Examples & exercises were easily connected to daily work. Hands-on training sessions were extremely helpful. Very knowledgeable Instructor. He answered my questions patiently every time when I was struggling.
L
Lee Hui Ling
Researcher, National University Hospital
★★★★★
Good execution of the training. Suitable real-life scenarios used during the training for Sensitivity & Scenario planning exercises. I learned so many useful Excel functions to do basic and advanced data analysis and gain immediate insights into our data.
M
Mohd Hashim
Singapore Aero Engine Services Pte Ltd
★★★★★
Trainer gives useful tips to navigate Microsoft Excel and doing a dashboard. Trainer takes time to get to know students which is nice. Easy to understand. Clear steps. Very interesting and engaging way of delivering the training. Awesome Trainer
M
Mohamad Sharil Bin Mohd Yusoff
Technical Officer, SP Group
★★★★★
Mr. Vinai Prakash is able to create interesting analogies for students to easily understand on the excel techniques. New Excel features never been used before, trainer shared importance of analysing data not just obtaining the data and workshop hands-on.
A
Aidliana bte Sa'at
Supervisor, SMRT Corporation
★★★★★
The trainer made it simple to understand
Laptops were provided
There were example data given
C
Chua Zhi Hua
Clinical Research Coordinator, NUH
Common Questions
Frequently Asked Questions
How much does the Advanced Data Analytics & Visualization with Excel course cost, and what grants are available? ▾
The full course fee shown on the page is S$900 before GST and government funding. The page states that eligible learners may receive either 70% SSG funding or 50% SSG funding, and Singaporeans can also use SkillsFuture Credit to offset course fees. Based on the page, the 70% funding example shows a lower payable amount than the 50% funding tier. UTAP and SFEC are also referenced on the course page for additional support options.
How long is this Excel data analytics course? ▾
This is a 2-day advanced Excel training course. The page repeatedly describes it as a practical, hands-on 2 day workshop focused on data analysis, forecasting, dashboards, and business reporting. Public class dates are listed on the page, and corporate runs can also be arranged.
What are the prerequisites for joining this course? ▾
This is not a beginner Excel class. Learners should already have good knowledge of Excel, use it regularly, and be comfortable with basic functions such as SUM and IF, as well as basic chart creation. The page also notes that people with database, business intelligence, or IT programming experience may still be suitable even if they use Excel less often in daily work.
Will I receive a certificate after completing the course? ▾
Yes. Participants who successfully complete the training and pass the short assessment at the end will receive a WSQ Certificate of Attainment issued under the Singapore Skills Framework. To qualify for the WSQ grant and certificate, participants must also meet the minimum attendance requirement of 75% set by SSG.
Is the course classroom-based, online, or available for corporate onsite training? ▾
This is a classroom-based, hands-on training course with guided exercises. Corporate training can be arranged at your office, which is useful for team-based learning. Public classes will be held at #10-08 Fortune Centre, Singapore 188979
Who should attend this advanced Excel analytics course? ▾
This course is aimed at data analysts, managers, decision-makers, and regular Excel users who struggle with reporting, cleanup, advanced PivotTables, and visualization techniques. It is especially relevant for professionals who already work with Excel and need stronger business analytics and dashboarding skills. If your work involves reporting, trend analysis, or presenting insights to management, this course is a strong fit.
How do I register for the course? ▾
The page says learners can register by clicking the chosen course date shown on the page. If you need help, you can also contact Intellisoft Systems by phone, WhatsApp, or email to ask questions before registering. This is useful if you want to confirm grant eligibility, class schedules, or whether a corporate run is more suitable.
Do I need to bring my own laptop or Excel software? ▾
You may bring your own laptop if you prefer. The page also states that learners can request to use Intellisoft's computer during class, and a copy of Microsoft Excel will be provided for use in the session. That makes it easier for participants who do not already have the correct Excel setup.
Advanced Data Analytics and Data Visualization with Excel
Enter your details and we'll send the full course brochure — complete outline, funding details, and registration instructions.
✅ Brochure on its way — check your inbox!
Free Tips, Tutorials & Training Grants Info
Learn from expert tips, tricks and resources for Excel, PowerPoint, Photoshop, Python, Power BI, Project Management, IT, Soft Skills & more with our Email Newsletter. Plus get the latest news on Grants. Join Today!


 Most data analysts, managers, decision-makers, and even end users typically struggle with report creation as they lack knowledge of features such as data analysis, data cleanup, advanced pivot tables techniques, and visualization techniques within Excel.