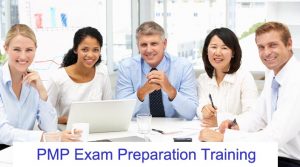
PMP® Exam Preparation Training Workshop
Aligned with the PMBOK® Guide, Seventh Edition
Introduction & Framework
Scope & Time Management
Cost, Quality & HR Management
|
Communication, Risk & Procurement
Stakeholder Management, Planning Sequence & Exam Matters
|
Training Methodology Classroom based lecture, discussions, mock test exam questions. Plus access to hundreds of questions in the PMI exam format, to help you practice for the actual PMP® exam. This course is very Exam Focused. Our objective is to help you pass the PMP Exam in your first attempt! Be prepared to do a huge number of questions, and apply the project management concepts in real life.
 This Project Management Preparation Training Course objective is to impart the required knowledge to project managers aspiring to get PMP® certification from PMI®.
This PMP® Certification Training is based on the Project Management Framework laid out by the Project Management Institute (PMI®), in the Project Management Body of Knowledge (PMBOK® Guide, Seventh edition).
This is a universally adopted standard framework used world-wide, and is considered the most holistic, practical and effective way to manage projects.. Learning Objectives of this PMP® Exam Prep® Training are:
- Pass the PMP® exam and become a Certified Project Management Professional (PMP®).
- Be able to use the tools and techniques you learned while studying for the PMP® exam to improve your abilities in managing projects.
- Learn exactly what to expect on the PMP® exam.
- Identify your strong and weak Knowledge Areas, so that you can study and master them.
- How to identify and easily handle all types of questions found on the PMP® exam
- Make the best use of study time to be successful in passing the PMP® exam.
- FURTHER – All Students Get Access to Hundreds of Practice Questions to help you Prepare for the PMP® Examination conducted by PMI®. The practice questions are exactly in the same type and format as what comes in the PMP® examination.
- Material – PMP® exam preparation notes in folders will be provided, Study Material, Extra Handouts and Tip Sheets.
- The PMP® exam changed, and is now based on PMBOK® Guide Seventh edition. Our Exam Preparation course has been modified to incorporate the new changes in this edition. Make sure you join the program which covers the new and latest material for the changed Exam Pattern and the latest PMBOK Guide Seventh edition.
- The course will give you the required 35 contact hours ( 35 PDUs ) to qualify to sit for the PMP® Certification exam.
This program is highly recommended for all new and experienced executives, directors and project managers with functional or project responsibilities, who are aspiring to get a PMP® Certification from PMI®.
You can time yourself, and see the time spent on each knowledge area of the PMP® exam. This will guide you and help you identify any areas where you are weak, so that you can practice more, and ensure success in the PMP® exam in your FIRST attempt. Meet your PMP® Certification requirements now.
Email to training@intellisoft.com.sg for more information on the PMP® Training Workshop.
Post-Course Support
- We provide free consultation related to the subject matter after the course.
- Please email your queries to training@intellisoft.com.sg and we will forward your queries to the subject matter experts.
Venue:
All courses are conducted at Intellisoft Training Rooms at 190 Middle Road, 10-08 Fortune Centre, Singapore 188979.
Short walk from Bencoolen MRT, Bugis, Rochor, Bras Basah MRT stations. The venue is disabled-friendly. For directions, click Contact Us.
This Project Management Preparation Training Course objective is to impart the required knowledge to project managers aspiring to get PMP® certification from PMI®.
This PMP® Certification Training is based on the Project Management Framework laid out by the Project Management Institute (PMI®), in the Project Management Body of Knowledge (PMBOK® Guide, Seventh edition).
This is a universally adopted standard framework used world-wide, and is considered the most holistic, practical and effective way to manage projects.. Learning Objectives of this PMP® Exam Prep® Training are:
- Pass the PMP® exam and become a Certified Project Management Professional (PMP®).
- Be able to use the tools and techniques you learned while studying for the PMP® exam to improve your abilities in managing projects.
- Learn exactly what to expect on the PMP® exam.
- Identify your strong and weak Knowledge Areas, so that you can study and master them.
- How to identify and easily handle all types of questions found on the PMP® exam
- Make the best use of study time to be successful in passing the PMP® exam.
This program is highly recommended for all new and experienced executives, directors and project managers with functional or project responsibilities, who are aspiring to get a PMP® Certification from PMI®.
You can time yourself, and see the time spent on each knowledge area of the PMP® exam. This will guide you and help you identify any areas where you are weak, so that you can practice more, and ensure success in the PMP® exam in your FIRST attempt. Meet your PMP® Certification requirements now.
Email to training@intellisoft.com.sg for more information on the PMP® Training Workshop.
PMP® Exam Preparation Training Workshop
Aligned with the PMBOK® Guide, Seventh Edition
Introduction & Framework
Scope & Time Management
Cost, Quality & HR Management
|
Communication, Risk & Procurement
Stakeholder Management, Planning Sequence & Exam Matters
|
Training Methodology Classroom based lecture, discussions, mock test exam questions. Plus access to hundreds of questions in the PMI exam format, to help you practice for the actual PMP® exam. This course is very Exam Focused. Our objective is to help you pass the PMP Exam in your first attempt! Be prepared to do a huge number of questions, and apply the project management concepts in real life.
- FURTHER – All Students Get Access to Hundreds of Practice Questions to help you Prepare for the PMP® Examination conducted by PMI®. The practice questions are exactly in the same type and format as what comes in the PMP® examination.
- Material – PMP® exam preparation notes in folders will be provided, Study Material, Extra Handouts and Tip Sheets.
- The PMP® exam changed, and is now based on PMBOK® Guide Seventh edition. Our Exam Preparation course has been modified to incorporate the new changes in this edition. Make sure you join the program which covers the new and latest material for the changed Exam Pattern and the latest PMBOK Guide Seventh edition.
- The course will give you the required 35 contact hours ( 35 PDUs ) to qualify to sit for the PMP® Certification exam.
Post-Course Support
- We provide free consultation related to the subject matter after the course.
- Please email your queries to training@intellisoft.com.sg and we will forward your queries to the subject matter experts.

Learn By Doing
You learn best when you Do It Yourself.
We teach you, step by step, how you can learn new skills, build your knowledge and enhance your career prospects quickly & easily, with Practical Tips & Tricks!


Register for the 4 Days PMP Exam Preparation Training today by simply clicking on the chosen course date available at the top of this page. Need Help?
- Call us at +65 6250-3575, SMS / WhatsApp: +65 9066–9991
- Send an email to training@intellisoft.com.sg OR
- Submit an online enquiry if you have any questions regarding PMP Exam Preparation training.
We have regular public classes each month, and Corporate Training can be arranged at your office too! If you have a group of 10 or more participants interested in getting the PMP® certification, contact us for a Corporate Training on Weekdays or Weekends. We have conducted Corporate trainings in Singapore, India, Malaysia, Egypt, Vietnam, Indonesia to name a few countries.
NEW: Receive PMP® Exam Preparation Tips & Project Management Articles in your Email. Written by Project Management experts, these articles will provide you with an immense advantage & help you prepare for your PMP® certification quickly. You will learn ideas, tips, best practices of managing and executing projects successfully, and in passing the PMP® examination in your first attempt.
.myForm td, input, select, textarea, checkbox {
font-family: tahoma;
font-size: 12px;
}
.required {
color: red;
}
| * Name: | |
| * Your Email Address: | |
| * Country: | |
| * Enter the security code shown: |
var SIDString = ”;
function getRandomLetter() { return String.fromCharCode(getRandom(65, 90)); } function getRandom(lowerBound, upperBound) { return Math.floor((upperBound – lowerBound + 1) * Math.random() + lowerBound); } function SetSID() { if (SIDString.length > 0) { return SIDString; } sidc = 0; while (sidc < 32)
{
SIDString = SIDString + getRandomLetter();
sidc++;
}
return SIDString;
}
var url = “http://www.regular-contact.com/imailpro/admin/resources/form_designs/captcha/index.php?c=” + getRandom(1,1000)+ “&ss=” + SetSID();
document.write(“ |
function CheckMultiple2(frm, name) { for (var i=0; i < frm.length; i++) { fldObj = frm.elements[i]; fldId = fldObj.id; if (fldId) { var fieldnamecheck=fldObj.id.indexOf(name); if (fieldnamecheck != -1) { if (fldObj.checked) { return true; } } } } return false; } function CheckForm2(f) { if (f.email.value == "") { alert("Please enter your email address."); f.email.focus(); return false; } if (f.captcha.value == "") { alert("Please enter the security code shown"); f.captcha.focus(); return false; } var fname = "CustomFields_8_2"; var fld = document.getElementById(fname); if (fld.value == "") { alert("Please enter a value for field Name"); fld.focus(); return false; } var fname = "CustomFields_23_2"; var fld = document.getElementById(fname); if (fld.value.match(/^s+$/)|| fld.value == "") { alert("Please enter a value for field Country"); fld.focus(); return false; } return true; };


 This 3-day hands-on training is for anyone beginning to learn Photoshop, this course will be their ideal starting point. Best suitable for working professionals and students who would like to learn the latest digital editing and Adobe Photoshop concepts.


 Prerequisites: