This course takes a step-by-step approach to learning and applying agentic AI, starting from core concepts and advancing toward real-world implementation.
The learning path is thoughtfully sequenced to ensure each skill builds on the previous one, providing a clear, logical progression.
COURSE OUTLINE for AGENTIC AI AUTOMATION COURSE
🔹 Section 1: Introduction to AI Agents and Workflows
-
Understand what Agentic AI is, and how it differs from Generative AI.
-
Explore key reasoning frameworks that power intelligent agents.
-
Analyze use cases across industries and identify where agentic workflows can be applied.
-
Create your first AI agent using platforms like n8n and Langflow.
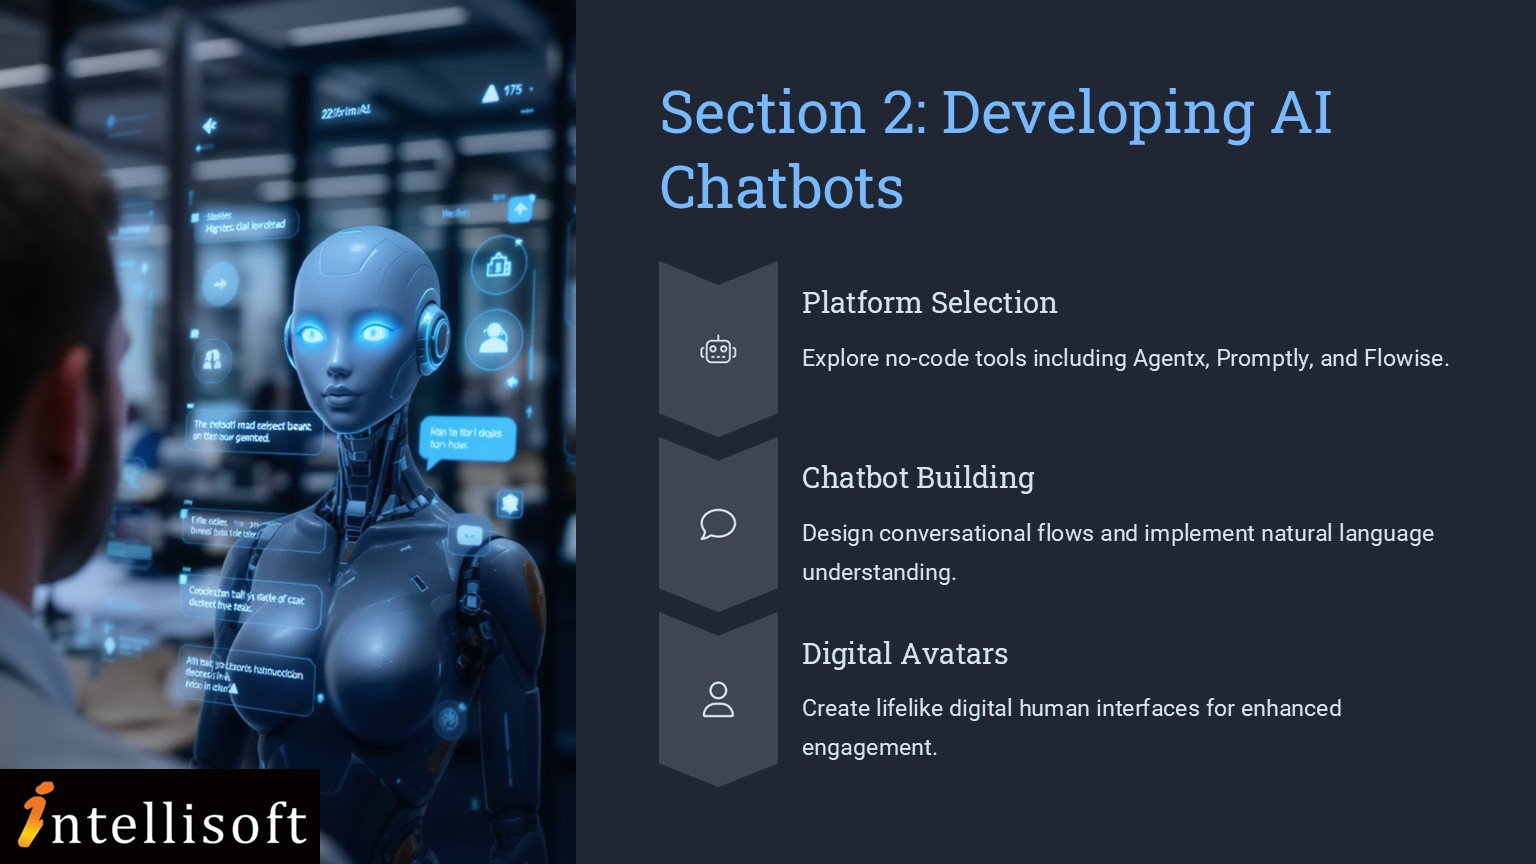
🔹 Section 2: Developing AI Chatbots
-
Dive into no-code chatbot development using Agentx, Promptly, and Flowise.
-
Learn how to integrate digital human avatars via HeyGen to create engaging AI experiences.
-
Correlate AI algorithm design with efficiency in product management workflows.
-
Improve existing agent applications for real-world use cases.
🔹 Section 3: Implementing RAG Applications
-
Understand the architecture and benefits of Retrieval Augmented Generation (RAG).
-
Build agentic RAG applications to enhance AI reasoning and context retention.
-
Leverage Microsoft Copilot Studio to develop intelligent RAG-based search and research agents.
-
Evaluate AI’s effectiveness and feasibility for product development and maintenance.
By progressing from foundational theory to hands-on practice and advanced applications, you are equipped not just with tools, but with strategic insight into building scalable, intelligent systems in this practical Agentic AI Automation course in Singapore at Intellisoft.
mailto:training@intellisoft.com.sg?subject=Interest_in_Agentic_AI_CoursesThis Agentic AI Automation Course at Intellisoft Systems systematically breaks down the complex aspects of AI agents, chatbot development, and RAG applications.
Acquire New Skills – Build Agentic AI Automations without any coding
By attending this innovative and cutting edge AI Agentic training, you will gain the following skills & abilities:
- Ability to analyze AI Agents algorithms and identify strengths and limitations in non-coding platform applications.
- Proficiency in correlating AI Agents algorithm design with efficiency and assessing improvements in AI Agent applications for product management.
- Skill in evaluating AI Agents application effectiveness and assessing feasibility for product and maintenance processes.
Post-Training Benefits for You, the Learners of Agentic AI Automation Development
By acquiring these Agentic AI automations without any coding, you will gain immense benefits:
- Enhanced ability to critically analyze AI algorithms, leading to more informed decision-making in non-coding platform applications.
- Improved capability to design efficient AI solutions, resulting in better product management and innovation.
- Increased competence in evaluating AI application effectiveness, ensuring feasible and sustainable product and maintenance processes.
This Agentic AI course is open to everyone. You just need:
-
Basic computer literacy (using a browser, navigating websites, basic file handling)
-
An interest in AI, new technologies, or how things work behind the scenes
-
Curiosity about web-based apps, no-code or low-code development
No coding experience is required. If you’re comfortable using everyday tools like ChatGPT, Canva, Excel etc. you should be good.
This Agentic AI Automation course is ideal for:
-
Non-developers who want to build AI solutions without writing code
-
Product managers and project leads looking to automate workflows and enhance productivity with AI
-
Entrepreneurs and startup founders exploring how AI can streamline operations and customer interaction
-
Educators and trainers interested in building intelligent, interactive learning tools
-
Digital marketers, content creators, and researchers who want to automate repetitive tasks
-
IT and operations professionals exploring low-code/no-code AI solutions for internal use
-
Anyone curious about agentic AI, chatbots, RAG applications, and automation tools
This is a 2 day course. You can email us to update us of your interest.
If you have any questions about your target audience, pre-requisites for this course or want to arrange a corporate training for your company, do let us know. Email to training@intellisoft.com.sg
Post-Course Support
- We provide free consultation related to the subject matter after the course.
- Please email your queries to training@intellisoft.com.sg and we will forward your queries to the subject matter experts.
Venue:
All courses are conducted at Intellisoft Training Rooms at 190 Middle Road, 10-08 Fortune Centre, Singapore 188979.
Short walk from Bencoolen MRT, Bugis, Rochor, Bras Basah MRT stations. The venue is disabled-friendly. For directions, click Contact Us.
mailto:training@intellisoft.com.sg?subject=Interest_in_Agentic_AI_CoursesThis Agentic AI Automation Course at Intellisoft Systems systematically breaks down the complex aspects of AI agents, chatbot development, and RAG applications.
Acquire New Skills – Build Agentic AI Automations without any coding
By attending this innovative and cutting edge AI Agentic training, you will gain the following skills & abilities:
- Ability to analyze AI Agents algorithms and identify strengths and limitations in non-coding platform applications.
- Proficiency in correlating AI Agents algorithm design with efficiency and assessing improvements in AI Agent applications for product management.
- Skill in evaluating AI Agents application effectiveness and assessing feasibility for product and maintenance processes.
Post-Training Benefits for You, the Learners of Agentic AI Automation Development
By acquiring these Agentic AI automations without any coding, you will gain immense benefits:
- Enhanced ability to critically analyze AI algorithms, leading to more informed decision-making in non-coding platform applications.
- Improved capability to design efficient AI solutions, resulting in better product management and innovation.
- Increased competence in evaluating AI application effectiveness, ensuring feasible and sustainable product and maintenance processes.
This Agentic AI Automation course is ideal for:
-
Non-developers who want to build AI solutions without writing code
-
Product managers and project leads looking to automate workflows and enhance productivity with AI
-
Entrepreneurs and startup founders exploring how AI can streamline operations and customer interaction
-
Educators and trainers interested in building intelligent, interactive learning tools
-
Digital marketers, content creators, and researchers who want to automate repetitive tasks
-
IT and operations professionals exploring low-code/no-code AI solutions for internal use
-
Anyone curious about agentic AI, chatbots, RAG applications, and automation tools
This is a 2 day course. You can email us to update us of your interest.
If you have any questions about your target audience, pre-requisites for this course or want to arrange a corporate training for your company, do let us know. Email to training@intellisoft.com.sg
This course takes a step-by-step approach to learning and applying agentic AI, starting from core concepts and advancing toward real-world implementation.
The learning path is thoughtfully sequenced to ensure each skill builds on the previous one, providing a clear, logical progression.
COURSE OUTLINE for AGENTIC AI AUTOMATION COURSE
🔹 Section 1: Introduction to AI Agents and Workflows
-
Understand what Agentic AI is, and how it differs from Generative AI.
-
Explore key reasoning frameworks that power intelligent agents.
-
Analyze use cases across industries and identify where agentic workflows can be applied.
-
Create your first AI agent using platforms like n8n and Langflow.
🔹 Section 2: Developing AI Chatbots
-
Dive into no-code chatbot development using Agentx, Promptly, and Flowise.
-
Learn how to integrate digital human avatars via HeyGen to create engaging AI experiences.
-
Correlate AI algorithm design with efficiency in product management workflows.
-
Improve existing agent applications for real-world use cases.
🔹 Section 3: Implementing RAG Applications
-
Understand the architecture and benefits of Retrieval Augmented Generation (RAG).
-
Build agentic RAG applications to enhance AI reasoning and context retention.
-
Leverage Microsoft Copilot Studio to develop intelligent RAG-based search and research agents.
-
Evaluate AI’s effectiveness and feasibility for product development and maintenance.
By progressing from foundational theory to hands-on practice and advanced applications, you are equipped not just with tools, but with strategic insight into building scalable, intelligent systems in this practical Agentic AI Automation course in Singapore at Intellisoft.
This Agentic AI course is open to everyone. You just need:
-
Basic computer literacy (using a browser, navigating websites, basic file handling)
-
An interest in AI, new technologies, or how things work behind the scenes
-
Curiosity about web-based apps, no-code or low-code development
No coding experience is required. If you’re comfortable using everyday tools like ChatGPT, Canva, Excel etc. you should be good.
Post-Course Support
- We provide free consultation related to the subject matter after the course.
- Please email your queries to training@intellisoft.com.sg and we will forward your queries to the subject matter experts.
Venue:
All courses are conducted at:
190 Middle Road, 10-08 Fortune Centre, Singapore 188979. 5 mins walk from Bencoolen MRT station. Bugis, Rochor, Bras Basah MRT are nearby, within walking distance.
The venue is disabled-friendly.

SkillsFuture Ready
Singaporeans can use $500 SkillsFuture Credits for this training to offset the course fees.
Contact us for advise on how to go about claiming your SkillsFuture.
Get Started Today!

Learn By Doing
You learn best when you Do It Yourself.
We teach you, step by step, how you can learn new skills, build your knowledge and enhance your career prospects quickly & easily, with Practical Tips & Tricks!


How To Register For Excel VBA Software Design Course in Singapore
Register for the 3 Days Excel VBA Macro Course today by simply clicking on the chosen course date available at the top of this page.
Need Help?
Call us at +65-6250-3575, SMS / WhatsApp: 9066-9991
Send an email to training@intellisoft.com.sg
We have regular public classes For Excel VBA Programming training each month, and Corporate Training can be arranged at your office too!

Note: This class uses a convenient and hands-on approach to gain Excel VBA Mastery. It requires you to take part in VBA programming exercises during the class. You can bring your own laptop or request to use our computer during the class beforehand.
WSQ Funded Excel VBA Training:
Join today, and begin to Master Excel VBA coding with our step-by-step instructions and helpful, patient Microsoft Certified Trainers to guide you.
What are you waiting for? Get Started Right away…


 Most data analysts, managers, decision-makers, and even end users typically struggle with report creation as they lack knowledge of features such as data analysis, data cleanup, advanced pivot tables techniques, and visualization techniques within Excel.