In Microsoft Excel, some of the new features are sparklines and slicers, and improvements to PivotTables and other existing features, can help us to discover patterns or trends in the data. To get started with the features of Excel, first we will look at the details of the Sparklines and slicers features of Excel.
Sparklines

Sparklines are tiny charts that is used to fit in a cell to visually summarize trends beside the data.
Since sparklines show trends occupies less space, they are exclusively useful for dashboards and other places where we need to show a glimpse of the business in an simple practical visual format.
In the image to the left, the sparklines that appear in the Trend column lets us have a quick look of the performance of each department in the month of May.
Slicers

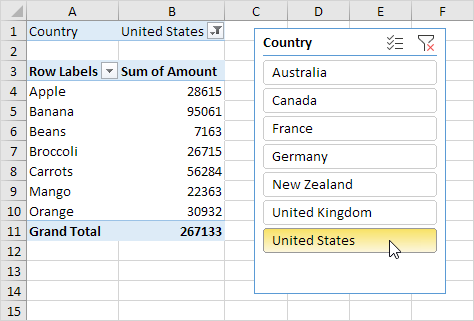
Slicers are visual controls. They let us quickly refine data in a PivotTable in an interactive, automatic manner. If we insert a slicer, we can use buttons to quickly segment and refine the data to display appropriate results.
Not only that, when we apply more than one filter to the PivotTable, we no longer have to open a list to see which filters are enforced to the data. Rather, it is displayed on the screen in the slicer.
We can make slicers relate to the workbook formatting and easily reuse them in other PivotTables & PivotCharts.
If you would like to learn more about these new features of Microsoft Excel / Office 365, or would like to attend the Advanced Microsoft Excel Training, do contact us at Intellisoft Systems.
If you have any further questions or want to join a training on how to use Sparklines, contact Intellisoft for Corporate Training on Excel or call at +65 6250-3575
Trainer: We have certified trainers who excel in imparting their knowledge and are very patient. Master Trainer Vinai teaches Advanced Excel Techniques, Dashboard Techniques using Excel, Data Interpretation and Analysis Training courses at Intellisoft.
He has conducted over 700 live workshops, and trained over 5,000 students in over 18 countries, and regularly conducts Excel Workshops in Singapore, Malaysia, Indonesia, Australia, India, Dubai, Egypt, Zimbabwe, South Africa etc.
