Excel Pivot Tables help us to discover patterns or trends in the data.
Here is a quick tutorial on Pivot Tables in Excel which highlights the new features added in Microsoft Office 365, Office 2019, and Microsoft Office 2016 or earlier versions of Excel.
Master pivot tables hands-on in our 3-day Advanced Excel Training Singapore, with 70% WSQ Funding & it is SkillsFuture claimable.
Earlier we had a look at the Sparklines and Slicers features of Excel so now we will look at the improved pivot table feature of excel.
Learn Improved Pivot Tables in Excel
PivotTables are now easier to use and more responsive. Key improvements include:
- Performance enhancements: In Excel, Multi-threading helps advanced sorting, data retrieval and filtering in Pivot Tables.
- Write-back support: In Excel, we can update values in the OLAP PivotTable Values area and then transferred to the Analysis Services cube on the OLAP server. We can use the write-back feature in what-if mode and then roll back the changes when we no longer need them, or we can save the changes. We can use the write-back feature with any OLAP provider that supports the UPDATE CUBE statement.
- Enhanced filtering: We can use slicers to quickly het the required data in a PivotTable and see which filters are applied without having to open additional menus. In addition, the filter interface includes a handy search box that can help us to find what we need among potentially thousands (or even millions) of items in the PivotTables.
- Pivot Table labels: We can add labels in a Pivot Table and also replicate them in the Pivot Tables. This will help us to display item captions of nested fields in all rows and columns.
- PivotChart enhancements: It has made things easy to interact with PivotChart reports. Specifically, it’s easier to get the required data directly in a PivotChart and to reorganize the layout of a PivotChart by adding and deleting fields. Similarly, we can hide all field buttons on the PivotChart report.
- Show Values As feature: The ‘show values as’ feature includes a number of new, automatic calculations, such as % of Parent Row Total, % of Parent Column Total, % of Parent Total, % Running Total, Rank Smallest to Largest, and Rank Largest to Smallest.
If you are new to Excel, or do not have much experience with the foundational concepts of Microsoft Excel, you can join our most popular 2 day Basic Excel Course Singapore with WSQ Grants. It is a 2 days immersive class with a certified and patient, expert Trainer.
How To Create a Pivot Table in Excel
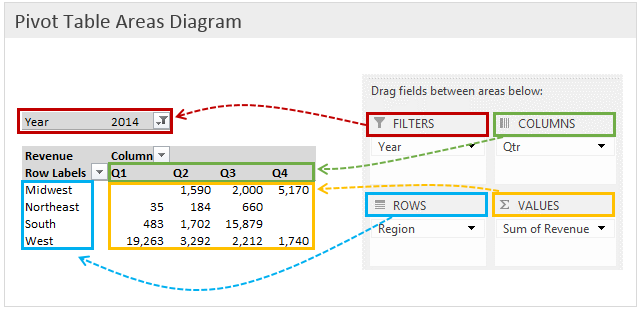
- Drag and drop fields from your data into the “Rows,” “Columns,” “Values,” and “Filters” areas in the PivotTable Field List.
- Rows: This area represents the rows of your pivot table, often used for categorizing data.
- Columns: This area represents the columns of your pivot table, creating a hierarchical structure.
- Values: This area represents the values you want to summarize or calculate, such as sums or averages.
- Filters: This area allows you to apply filters to your data before generating the pivot table.
- Customize Values: You can change the way your values are summarized by clicking on the drop-down arrow next to a field in the “Values” area and selecting a summary function (e.g., Sum, Count, Average).
- Apply Filters: If you added fields to the “Filters” area, you can use the filter drop-downs in your pivot table to narrow down the data displayed.
- Format and Style: Format and style your pivot table to make it visually appealing and easier to understand. You can use Excel’s formatting tools to adjust fonts, colors, and cell borders.
- Refresh Data: If your original data changes, you can refresh the pivot table to update it with the new data. Right-click on the pivot table and choose “Refresh.”
- Explore and Analyze: Use your pivot table to explore and analyze your data. You can easily rearrange fields, add or remove them, and experiment with different layouts.
Creating a pivot table might seem a bit complex at first, but once you become familiar with the process, you’ll find it to be a powerful tool for data analysis and reporting in Excel.
 If you would like to learn more about these new features of Microsoft Excel, or would like to attend the Microsoft Excel Training, do contact us at Intellisoft Systems.
If you have any further questions then contact us through email training@intellisoft.com.sg Systems or call at +65 6250-3575!!!
Your Pivot Table Trainer is Vinai Prakash.
Vinai teaches Advanced Excel Techniques, Dashboard Techniques using Excel, Data Interpretation and Analysis Training courses at Intellisoft.
He has trained over 15,000 students in over 18 countries, and regularly conducts Excel Workshops in Singapore, Malaysia, Indonesia, Australia, India, Dubai, Egypt, Zimbabwe, South Africa etc.
Why Use Pivot Tables in Excel:
Pivot tables are a powerful tool in Excel that offer a range of benefits for data analysis, summarization, and reporting. Here are some examples of why you should use pivot tables and the key advantages they provide:
1. Data Summarization: Pivot tables allow you to quickly summarize and aggregate large datasets. They can help you calculate sums, averages, counts, percentages, and more, without requiring complex formulas.
Example: Summarizing sales data to calculate total revenue, average sales per region, or the number of units sold by product category.
2. Data Analysis: Pivot tables enable you to analyze data from multiple perspectives by arranging fields dynamically. This flexibility allows you to uncover patterns, trends, and insights within your data.
Example: Analyzing website traffic data to determine which pages are most visited, identify traffic sources, and compare user engagement across different time periods.
3. Quick Report Generation: Pivot tables provide a rapid way to generate comprehensive reports from your data. You can customize the layout, apply filters, and instantly update the report as your data changes.
Example: Creating monthly financial reports with detailed breakdowns of expenses, revenues, and profits across various departments or projects.
4. Interactive Dashboards: Pivot tables can be part of interactive dashboards. When combined with slicers and pivot charts, they allow users to dynamically explore data and instantly visualize trends.
Example: Building a sales dashboard where users can filter data by product, region, or time period using slicers and see the results in pivot charts and tables.
5. Easy Data Restructuring: Pivot tables make it easy to reorganize data on the fly. You can quickly change the order of rows and columns to view data from different angles.
Example: Rearranging survey data to view responses based on different demographic categories like age groups, gender, or education levels.
6. Data Cleansing and Filtering: Pivot tables can help you clean and filter your data. You can easily remove duplicates, filter out irrelevant records, and focus on specific subsets of your data.
Example: Identifying and removing duplicate entries from a customer database or filtering out low-performing products from a sales dataset.
Key Advantages of Pivot Tables:
- Efficiency: Pivot tables allow you to perform complex data analysis tasks quickly, without requiring in-depth knowledge of formulas or programming.
- Dynamic Exploration: You can easily switch, add, or remove fields to explore data from different angles, helping you uncover hidden insights.
- Flexibility: Pivot tables accommodate changes in data structure or values, allowing you to update your reports and analysis effortlessly.
- Compact Presentation: Pivot tables provide summarized results in a compact and easy-to-read format, making it simpler to communicate key findings to stakeholders.
- Interactivity: By using slicers and pivot charts in conjunction with pivot tables, you can create interactive reports and dashboards that facilitate user-driven analysis.
- No Data Alteration: Pivot tables do not alter your source data. They create a separate view of your data for analysis purposes, ensuring data integrity.
Pivot tables in Excel are essential for transforming raw data into actionable insights. They offer a range of benefits, including efficient data summarization, interactive analysis, and quick report generation.
Whether you’re working with sales figures, survey responses, financial data, or any other type of dataset, pivot tables can help you make sense of your information and make informed decisions.