Huh! What’s that?
Just see the image below & check where you see yourself – in Reporting Hell or Reporting Nirvana…
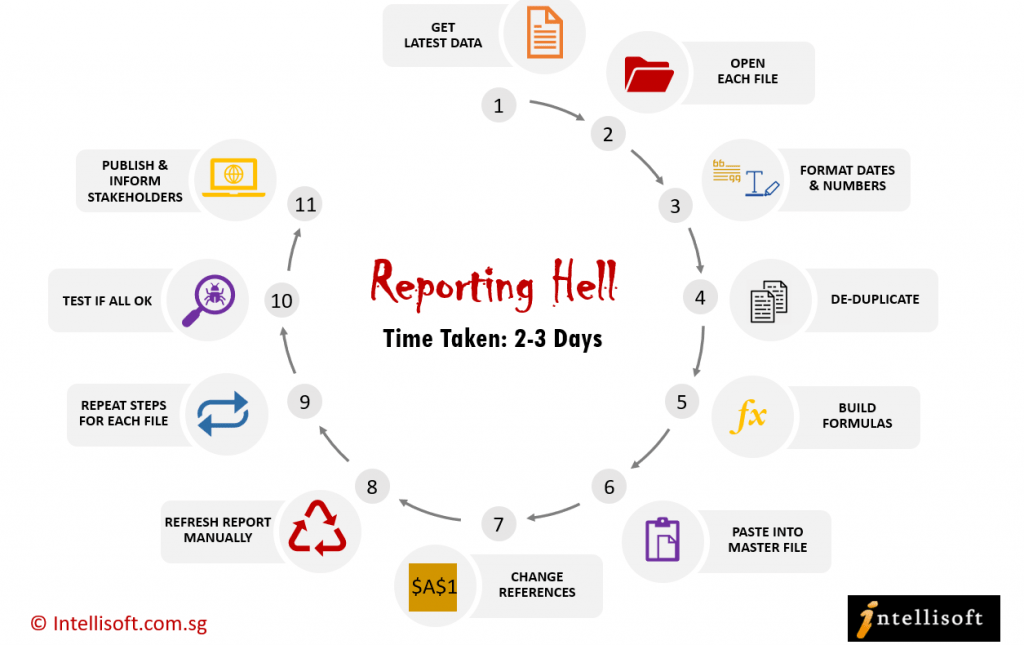
If you are trapped in Reporting Hell, here’s your Typical Reporting Day
Step 1: Bring the latest data files each month. This could be in Text, CSV, Excel files.
Step 2: Open each file.
Step 3: Format Dates, Numbers & Text correctly in each data file.
Step 4: Remove Duplicates and check the data rows don’t have any junk data.
Step 5: Build Calculation Formulas to work out interim values.
Step 6: Once the data is in good shape, Copy and paste this into the Master Data File in Excel File.
Step 7: Change Data Source of Dropdowns, Pivots, Charts to include new data pasted in the master file.
Step 8: Refresh the Report manually for each pivot, chart or data source.
Step 9: Repeat the same steps for each data file. This is a laborious task of data cleaning, transforming & loading the data, called as the ETL process.
Step 10: Test to see if all well well, and that you did not miss anything.
Step 11: Publish the Report online & Inform the key stakeholders of the new report availability.
Step 12: Keep Fingers Crossed!
Typical Total Time Taken: 6 Hours to 3 Days at a minimum
It is extremely frustrating & time-consuming to do the same manual steps each month to load the data, clean it, transform it and update all reports manually.
Most data analysts spend almost 90% of their time in loading & cleaning the data. They hardly have any time left to analyze or visualize the data to help the management make better decisions. They are stuck in doing the mundane, routine things, which is a total waste of their time.
If you are in such a situation, you are living in Reporting Hell.
It is time to move to completely automated, dynamic reporting, that self-updates each day, week or month, and your users can consume the reports on any device, instantly. It is like living in Reporting Nirvana – a completely amazing and refreshing world, where you spend most time analyzing data productively.
Care to know more about Reporting Nirvana?
Reporting Nirvana: Typical Day
In Reporting Nirvana, here’s what your typical day looks like:
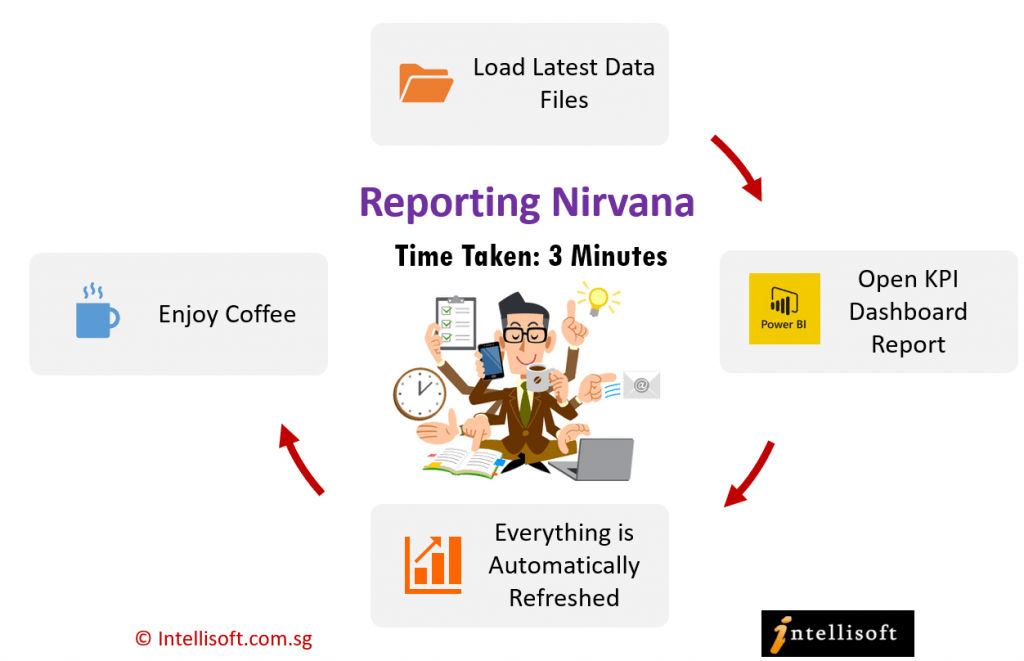
Step 1: Bring the latest data files in whatever format.
Step 2: Open the KPI Dashboard Report, which automatically picks the latest data files
Step 3: Everything is automatically Refreshed
Step 4: Enjoy your coffee!
Typical Total Time Taken: 3 minutes to 15 minutes at a maximum.
Achieve Reporting Nirvana
It’s time to move to Reporting Nirvana With Microsoft Power BI automation tools – Power Query, Power Pivot, & Power BI or with Excel Dashboard Creation Techniques. Imagine the amount of time you can save by doing the manual steps only once, and getting them executed each week & each month automatically, without having to do anything?
Attend the 2 Day Excel Dashboard MasterClass & the 2 Day PowerQuery, PowerPivot & PowerBI Training.
Learn how you can achieve Reporting Nirvana, and spend your day doing smarter things, analyzing data and contributing to growing your company’s topline and bottom-line revenue! Contact us at training@intellisoft.com.sg
Cheers,
Vinai Prakash
Founder & Master Trainer: Intellisoft Systems