Sparklines Microsoft Excel

Practical hands-on basic Excel training

In Microsoft Excel, some of the new features are sparklines and slicers, and improvements to PivotTables and other existing features, can help us to discover patterns or trends in the data. To get started with the features of Excel, first we will look at the details of the  Sparklines and slicers features of Excel.

Sparklines
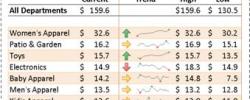
Sparklines in Microsoft Excel Traiing
https://www.trainingint.com/advanced-excel-2016-certification

Sparklines are tiny charts that is used to fit in a cell to visually summarize trends beside the data.

Since sparklines show trends occupies less space, they are exclusively useful for dashboards and other places where we need to show a glimpse of the business in an simple practical visual format.

In the image to the left, the sparklines that appear in the Trend column lets us have a quick look of the performance of each department in the month of May.

Slicers
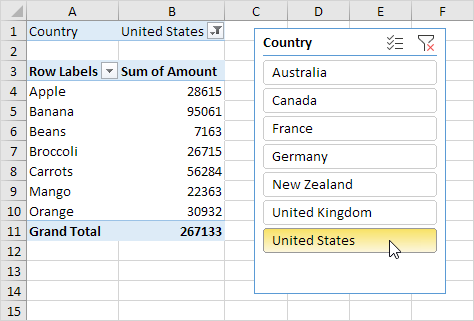
Excel Slicers Sample

Slicers are visual controls. They let us quickly refine data in a PivotTable in an interactive, automatic manner. If we insert a slicer, we can use buttons to quickly segment and refine the data to display appropriate results.

Not only that, when we apply more than one filter to the PivotTable, we no longer have to open a list to see which filters are enforced to the data. Rather, it is displayed on the screen in the slicer.

We can make slicers relate to the workbook formatting and easily reuse them in other PivotTables & PivotCharts.

If you would like to learn more about these new features of Microsoft Excel /  Office 365, or would like to attend the Advanced Microsoft Excel Training, do contact us at Intellisoft Systems.

If you have any further questions or want to join a training on how to use Sparklines, contact Intellisoft for Corporate Training on Excel or call at +65 6250-3575

Trainer: We have certified trainers who excel in imparting their knowledge and are very patient. Master Trainer Vinai teaches Advanced Excel Techniques, Dashboard Techniques using Excel, Data Interpretation and Analysis Training courses at Intellisoft.

He has  conducted over 700 live workshops, and trained over 5,000 students in over 18 countries, and regularly conducts Excel Workshops in Singapore, Malaysia, Indonesia, Australia, India, Dubai, Egypt, Zimbabwe, South Africa etc.

Do You Use These Advanced Features in Microsoft Excel?

Advanced Excel training at Intellisoft
Practical hands-on advanced excel training at Intellisoft

Most people hardly use the huge number of features available in Microsoft Excel. Many are just using Excel as a calculator. This is a gross under use of Excel’s vast potential and feature rich functionality.

Do a quick check, and see if you use these advanced features of Microsoft Excel in your day to day work.

Some of the common things that can be done easily with Excel are:

  1. Finding the Top 10 Customers or Finding the Bottom 10 Performers in the organization
  2. Highlight values that are above or below a certain threshold – like all sales above $25,000 to be highlighted
  3. Sort the values in Ascending, Descending or any customized order – like sorting in order of Manufacturing, Accounts, Sales departments.
  4. Give Names to Range of Cells, and then use them in formulas for easy referencing and decoding
  5. Exploit Pivot Tables to Summarize the data and slice & dice it in any way – finding sales by product groups, or calculating productivity by department
  6. Write Macros to automate routine things that save you a huge amount of time – example creating pivots, charts, tables, and doing complex calculations automatically.
  7. Use advanced filtering conditions, and be able to filter data using multiple different criteria
  8. Create fantastic charts that portray the given business situation perfectly. There are over 50 different types of charts to choose from, and each has its edge, advantages and a reason.
  9. Create management dashboard that are dynamic, and provide a complete snapshot of the key business KPIs in the company – change the chart values at the click of a checkbox or change in a drop-down value
  10. Use Excel’s advanced What-If analysis to do projections for future, forecasting, trend analysis etc. with ease
  11. Use Lookup tables to find any value or corresponding value from a table using advanced functions and formulas

This is just the tip of the iceberg. Microsoft Excel is really extremely powerful. Each version of Microsoft Excel – be it Excel 2007, or Excel 2010 or Excel 2013 adds more and more features to the already powerful dynamite of a package.

At Intellisoft, we teach people how to leverage the maximum power out of Microsoft Excel in short training courses. Some of the popular courses are:

We have a number of Public Classes each month, and we also provided In-House Training to your staff and team at your office, if you have a group of 10+ people, and have a room to hold the training.

So what are you waiting for? If you would like to learn any one or more of such useful features of Microsoft Excel, come for a short Excel Training at Intellisoft.

Go ahead, equip your team with the right skills. Get everyone on board to learn the basic and advanced features of Microsoft Excel, and Be Awesome in Excel!

Email to training@intellisoft.com.sg or call +65-6250-3575 for the next available schedule of Microsoft Excel Training in Singapore.

We are located at Fortune Centre, in Singapore! Location Map of Intellisoft

Cheers,
Vinai Prakash, PMP, ITIL, Six Sigma, GAP,
Master Trainer

Creating Management Dashboards in Microsoft Excel

Excel dashboard training Singapore

Today, Microsoft Excel has become extremely power tool for any data warrior. Whether you work in Sales, Marketing, Customer Service, Logistics, Accounts, Manufacturing, Finance or Administration, everyone must become an expert at using Microsoft Excel.

It is not sufficient to know Tables & Formulas in Excel. You must also know how to make sense of the data that you have.

Successful analysis of data, and presentation of data are vital skills for any office worker. Simple techniques to analyze data are to use Pivot Tables, Normal Data Ranges, and Tables.

Further, there are Advanced Data Analysis tools within Excel – like the Scenario Manager, Goal Seek, Solver, Conditional Formatting, Slicers etc. that make the job of data analysis much easier.

However, it is not sufficient to merely analyze the data. It is important for you to also present the data using the latest and best in-built techniques within Excel. Most of the people who come for Excel Dashboard Training, or the Data Analysis Training With Excel are not aware of these features.

Microsoft Excel Dashboard Training

Microsoft Excel Dashboard Training

When you create an Excel Report, which allows for the Report to become interactive, allows the management to play with the data, change the parameters, and see the data change, the graphs update dynamically, then such a report is called a Dashboard.

DIFFERENCE BETWEEN REPORTS AND DASHBOARDS

The key different between a Report and a Dashboard is that a Report can be static, long, and without any interactivity.

In contrast, a Dashboard is a dynamic report, Short, Fits a page usually, and allows the users to change several parameters on the fly to compare the data from the past year, quarter, and play what if dynamically.

Dynamic Checkbox Dashboard With Microsoft Excel

Dynamic Dashboard With Microsoft Excel – Learn to Do It Yourself!

Intellisoft Systems in Singapore conducts Public and Customized Classes for Creating Dashboards With Microsoft Excel. Many companies have opted for Corporate Training, where the content can be customized to suit your audience and participants, plus their level of expertise with Microsoft Excel.

For the dashboard training, the Excel version is not that important. You can use Microsoft Excel 2010, 2013 or Microsoft Excel 2016 for the Excel Dashboard Training.

Plus, the Dashboard training can be conducted in your country. Simply contact Intellisoft at +65-6250-3575 for the training details.

Cheers,
Intellisoft Systems Team, Fortune Centre, #10-08,
Singapore 188979

Recommended Training: Advanced Excel 2013Excel Dashboards MasterClassData Interpretation & AnalysisCustomized Corporate Training

Free Tips, Tutorials & Training Grants Info

Learn from expert tips, tricks and resources for Excel, PowerPoint, Photoshop, Python, Power BI, Project Management, IT, Soft Skills & more with our Email Newsletter.
Plus get the latest news on Grants. Join Today!

Found What You Were
Looking For?

Just Tell us...

We're Here To Help You!