
WSQ Grant of up to 50-70%
A good visualization tells a story, removing the noise from data and highlighting useful information, curating data into a form easier to understand, and highlighting the trends and outliers.
Advanced Data Analytics and Visualization course using Microsoft Excel, helps build complex models, making it easy to reach meaningful conclusions, and simplifies the decision-making process.
Companies can then use these insights to identify areas to improve upon and factors that influence customer satisfaction and make better predictions for sales and growth.
Data storytelling helps the data feel alive and ensures that the message it’s conveying is meaningful and relevant, by balancing logic and facts with the emotional impact of a story, companies can better engage their audiences and enhance interactions with their customer base during business events.
By the end of this practical business intelligence with Excel course, you will be able to apply advanced data analytics and data visualization techniques to identify underlying trends and patterns in data with Microsoft Excel.

Learning Data Science, Data Visualization & Data Analysis are critical skills in gaining a deeper understanding of your data and making better decisions. They help in analyzing the performance of the business & continuous improvement of processes.
This course covers a number of Statistical Data Analysis Techniques for Predictive Analytics, Data Mining, Advanced Data Visualization Techniques & much more… all using Microsoft Excel. Each method is demonstrated with examples & exercises for your own business analytics.
This is the highest level of Microsoft Excel MasterClass to learn advanced Data visualization & Business Analytics.
Classroom-based lectures with hands-on exercises on analyzing data using Microsoft Excel are used in this workshop to analyze & visualize data and find meaningful information. Data and business analytics provide valuable insights to management.
Advanced Data Analytics & Data Visualization Course With Excel
Course Outline
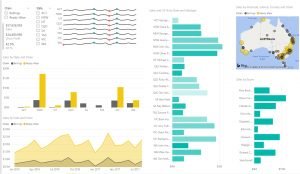
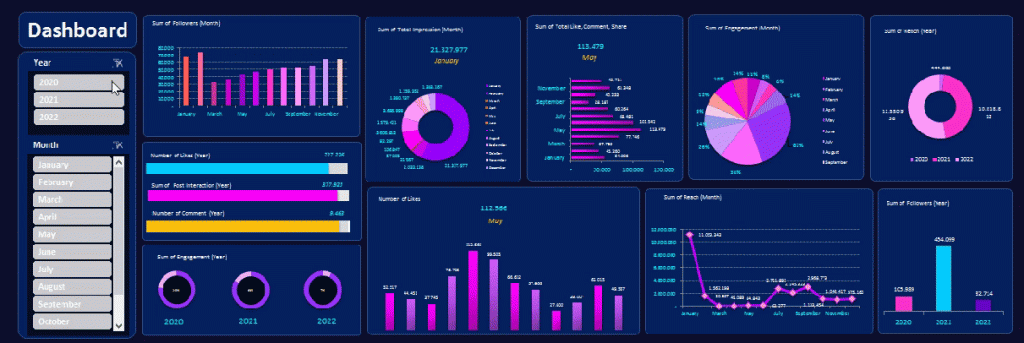
This is a very practical, hands-on, and insightful course, full of advanced Excel techniques to bring in the data, analyze it quickly, identify trends, and visualize the information in charts, graphs and dashboards.

Module 1: Data Modeling Using Pivot Tables & Pivot Charts
- Introduction to Data Modeling
- Data Filtering & Transformation
- Use Pivots to identify patterns across multiple data sets
- Visual Analysis with Pivot Charts
Module 2: Solver and Scenarios to Manage Multiple Constraints
- Managing Multiple Constraints
- Proof of concept using Data Solver
- Decision Making using Scenarios
Module 3: Data Modeling & Linear Regression for Better Forecasts
- Data Modeling Principles
- Building a Model With Excel
- Using Linear Regression
Module 4: Data Mining and Goal Seek To Derive Business Insights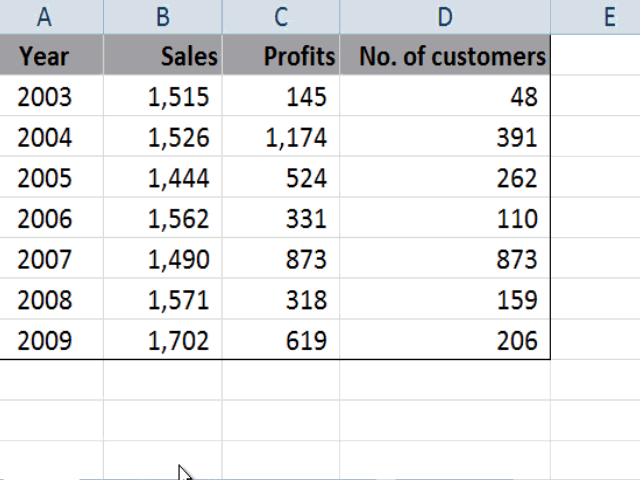
- Data Mining With Lookup Functions
- Business Insights From Goal Seek
- Advanced Use Cases for Data Mining With Excel Functions
Module 5: Statistical Analysis and Data Visualization Dashboards
- Key Principles of Data Visualization
- Presentation of qualitative data-driven visualization
- Statistical analysis of data
Learn The Secrets of Data Analysis With Excel Today in Singapore with Excel Advanced formulas course Singapore
Join This Practical Training
To Get Ahead With Advanced
Business Data Analysis & Visualization.

Learn The Best Excel Functions & Features for Data Analytics!
Business Data Analytics With Excel Course Trainer:

This Excel Data Analysis course is created and delivered by Vinai Prakash, Master Trainer & Founder of Intellisoft Systems.
Vinai has authored several articles on Data Analysis, Excel Dashboarding Techniques, Data Warehousing, Data Mining, Using SQL Databases for Creating Data-Rich applications, published in leading magazines, newspapers & books.
Click Here to Download The 8 Habits of Highly Effective Data Analysts(An article written by Vinai Prakash, published in The Straits Times Newspaper in Singapore)
Excel Data Analysis Course in Singapore at Intellisoft Systems, Singapore[/caption]
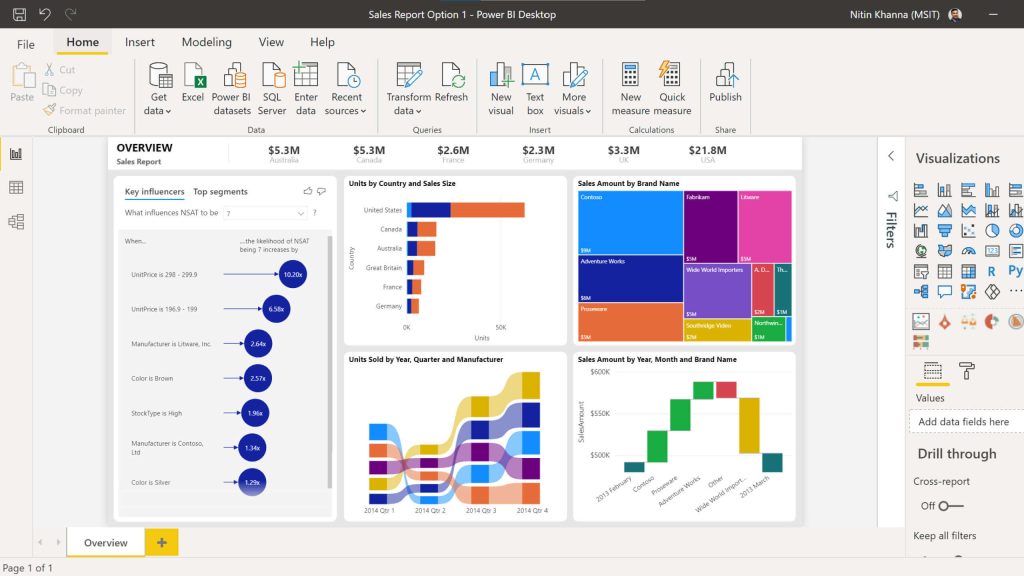
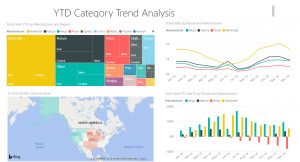
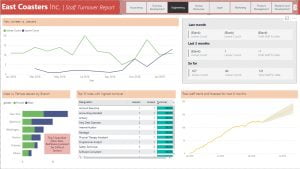
Data visualization allows business users to gain insight into their vast amounts of data.
It benefits them to recognize new patterns and errors in the data.
The main goal of data visualization is to make it easier to identify patterns, trends and outliers in large data sets.
Making sense of these patterns can lead to enhanced quality and speed of decision-making processes, as well as measurable increases in productivity and efficiency.

The objective of this Advanced Data Analytics & Data Visualization training is to help companies in using business intelligence tools to turn raw data into consumable insights, making it a powerful tool people can use to make better, data-driven decisions.
In this course, learners will learn how to leverage the power of Excel to organize and summarize data. They will learn how to use Trend Analysis, Advanced Pivot Table Techniques and Advanced charts to summarize data in a dynamic way based on a selection of values from a list or other Pivot tables.

The course covers Advanced Excel Data Analytics & Data Visualization Topics, like:
- Best Excel functions for deeper data analysis, data mining & business analytics
- Tips for cleansing, transforming & modelling data,
- Sensitivity Analysis with Data Tables,
- Goal Seek Find the missing pieces,
- Advanced Excel Visualisation Techniques using Multiple Charts, Pivots & Slicers
- Data Modeling & Linear Regression for Predictive Analysis
- Creation of Excel Dashboards for Business Intelligence & Management Reporting of Insights
Learn The Secrets of Data Analytics With Excel, & Become a Power Ninja Data Analyst!
It would be great if you have good knowledge of Excel and could write simple formulas like SUM, IF, Create Bar Charts and use Excel on a regular basis for basic analysis and reporting.
- Good knowledge and experience in using Excel on a regular basis.
- Familiarity with Basic Excel functions is a must.
- A passion for acquiring Data Analysis Superpowers.
- Note: Anyone with Database, Business Intelligence, IT Programming, or similar experience are pretty qualified to take this course, even if lacking in everyday Excel experience.
Microsoft Excel software is available for download from the Microsoft website as a subscription. We will provide you with a copy of Microsoft Excel for use in the class, on our laptops.
 Most data analysts, managers, decision-makers, and even end users typically struggle with report creation as they lack knowledge of features such as data analysis, data cleanup, advanced pivot tables techniques, and visualization techniques within Excel.
With this WSQ course, we target such people and will help such people learn advanced data analytic and data visualization techniques to organize data better and represent the same in both a dynamic tabular and chart format.
After attending this WSQ Advanced Excel Data Analytics & Visualization course, our audience will be better able to:
- Organize data within excel in a “normalized” way to create dynamic reports.
- Create Pivot tables and charts that provide a dynamic view of data based on slider selections.
- Create infographics summaries that are linked to the analyzed data and Pivot tables.
Post-Course Support
- We provide free consultation related to the subject matter after the course.
- Please email your queries to training@intellisoft.com.sg and we will forward your queries to the subject matter experts.
Venue:
All courses are conducted at Intellisoft Training Rooms at 190 Middle Road, 10-08 Fortune Centre, Singapore 188979.
Short walk from Bencoolen MRT, Bugis, Rochor, Bras Basah MRT stations. The venue is disabled-friendly. For directions, click Contact Us.
Excel Data Analysis Course in Singapore at Intellisoft Systems, Singapore[/caption]
Data visualization allows business users to gain insight into their vast amounts of data.
It benefits them to recognize new patterns and errors in the data.
The main goal of data visualization is to make it easier to identify patterns, trends and outliers in large data sets.
Making sense of these patterns can lead to enhanced quality and speed of decision-making processes, as well as measurable increases in productivity and efficiency.
The objective of this Advanced Data Analytics & Data Visualization training is to help companies in using business intelligence tools to turn raw data into consumable insights, making it a powerful tool people can use to make better, data-driven decisions.
In this course, learners will learn how to leverage the power of Excel to organize and summarize data. They will learn how to use Trend Analysis, Advanced Pivot Table Techniques and Advanced charts to summarize data in a dynamic way based on a selection of values from a list or other Pivot tables.
The course covers Advanced Excel Data Analytics & Data Visualization Topics, like:
- Best Excel functions for deeper data analysis, data mining & business analytics
- Tips for cleansing, transforming & modelling data,
- Sensitivity Analysis with Data Tables,
- Goal Seek Find the missing pieces,
- Advanced Excel Visualisation Techniques using Multiple Charts, Pivots & Slicers
- Data Modeling & Linear Regression for Predictive Analysis
- Creation of Excel Dashboards for Business Intelligence & Management Reporting of Insights
Learn The Secrets of Data Analytics With Excel, & Become a Power Ninja Data Analyst!
Most data analysts, managers, decision-makers, and even end users typically struggle with report creation as they lack knowledge of features such as data analysis, data cleanup, advanced pivot tables techniques, and visualization techniques within Excel.
With this WSQ course, we target such people and will help such people learn advanced data analytic and data visualization techniques to organize data better and represent the same in both a dynamic tabular and chart format.
After attending this WSQ Advanced Excel Data Analytics & Visualization course, our audience will be better able to:
- Organize data within excel in a “normalized” way to create dynamic reports.
- Create Pivot tables and charts that provide a dynamic view of data based on slider selections.
- Create infographics summaries that are linked to the analyzed data and Pivot tables.
Advanced Data Analytics & Data Visualization Course With Excel
Course Outline
This is a very practical, hands-on, and insightful course, full of advanced Excel techniques to bring in the data, analyze it quickly, identify trends, and visualize the information in charts, graphs and dashboards.
Module 1: Data Modeling Using Pivot Tables & Pivot Charts
- Introduction to Data Modeling
- Data Filtering & Transformation
- Use Pivots to identify patterns across multiple data sets
- Visual Analysis with Pivot Charts
Module 2: Solver and Scenarios to Manage Multiple Constraints
- Managing Multiple Constraints
- Proof of concept using Data Solver
- Decision Making using Scenarios
Module 3: Data Modeling & Linear Regression for Better Forecasts
- Data Modeling Principles
- Building a Model With Excel
- Using Linear Regression
Module 4: Data Mining and Goal Seek To Derive Business Insights
- Data Mining With Lookup Functions
- Business Insights From Goal Seek
- Advanced Use Cases for Data Mining With Excel Functions
Module 5: Statistical Analysis and Data Visualization Dashboards
- Key Principles of Data Visualization
- Presentation of qualitative data-driven visualization
- Statistical analysis of data
Learn The Secrets of Data Analysis With Excel Today in Singapore with Excel Advanced formulas course Singapore
Join This Practical Training
To Get Ahead With Advanced
Business Data Analysis & Visualization.
Learn The Best Excel Functions & Features for Data Analytics!
Business Data Analytics With Excel Course Trainer:
This Excel Data Analysis course is created and delivered by Vinai Prakash, Master Trainer & Founder of Intellisoft Systems.
Vinai has authored several articles on Data Analysis, Excel Dashboarding Techniques, Data Warehousing, Data Mining, Using SQL Databases for Creating Data-Rich applications, published in leading magazines, newspapers & books.
Click Here to Download The 8 Habits of Highly Effective Data Analysts(An article written by Vinai Prakash, published in The Straits Times Newspaper in Singapore)
It would be great if you have good knowledge of Excel and could write simple formulas like SUM, IF, Create Bar Charts and use Excel on a regular basis for basic analysis and reporting.
- Good knowledge and experience in using Excel on a regular basis.
- Familiarity with Basic Excel functions is a must.
- A passion for acquiring Data Analysis Superpowers.
- Note: Anyone with Database, Business Intelligence, IT Programming, or similar experience are pretty qualified to take this course, even if lacking in everyday Excel experience.
Microsoft Excel software is available for download from the Microsoft website as a subscription. We will provide you with a copy of Microsoft Excel for use in the class, on our laptops.
Post-Course Support
- We provide free consultation related to the subject matter after the course.
- Please email your queries to training@intellisoft.com.sg and we will forward your queries to the subject matter experts.
SkillsFuture Ready
Singaporeans can use $500 SkillsFuture Credits for this training to offset the course fees.
Contact us for advise on how to go about claiming your SkillsFuture.
Get Started Today!

Learn By Doing
You learn best when you Do It Yourself.
We teach you, step by step, how you can learn new skills, build your knowledge and enhance your career prospects quickly & easily, with Practical Tips & Tricks!


How To Register For Advanced Excel Course in Singapore
Register for the 2 Days Advanced Excel Data Analytics & Data Visualization MasterClass Course today by simply clicking on the chosen course date available at the top of this page.
Need Help?
Call us at +65-6250-3575, SMS / WhatsApp: 9066-9991
Send an email to training@intellisoft.com.sg
We have regular public classes For Advanced Data Analytics & Visualization With Excel MasterClass each quarter, and Corporate Training can be arranged at your office too!

Note: This class uses a convenient and hands-on approach to gain Excel Analytics & Visualization Mastery. It requires you to take part in Data Analysis & Data Visualization exercises during the class. You can bring your own laptop or request to use our computer during the class beforehand.
WSQ Funded Data Analytics and Visualization With Microsoft Excel Training:
Join today, and begin to Master Excel Data Analytics with our Step-by-step instructions and helpful, patient, Microsoft Certified Trainers to guide you.
What are you waiting for? Get Started Right away…