Many people have already used tools like ChatGPT, Claude, Gemini, or Microsoft Copilot.
These tools are useful. They can write, summarise, explain, translate, and create ideas.
This is called Generative AI.
But now, a new type of AI is becoming more important.
It is called Agentic AI.
Agentic AI can do more than answer questions. It can plan, take action, use tools, check results, and complete work.
Agentic AI Introduction for beginners
What is Agentic AI – An Explainer for All from Intellisoft Training
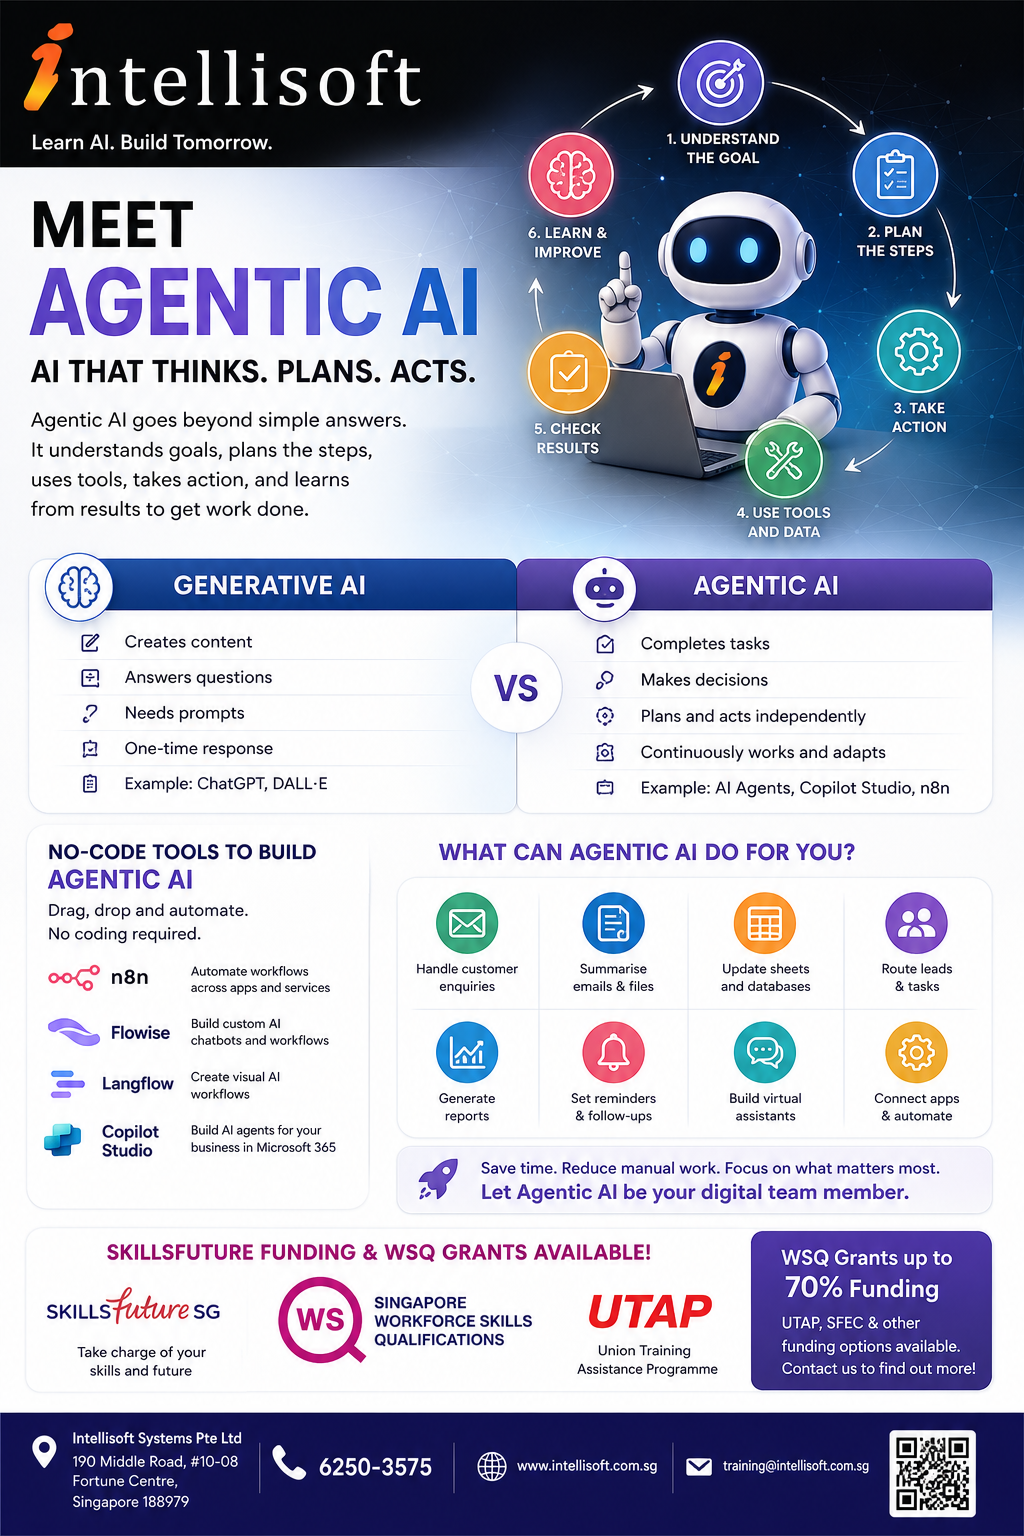
What is Agentic AI?
Agentic AI means AI that can work towards a goal.
It does not only wait for one prompt and give one answer.
It can understand what needs to be done.
It can break the task into steps.
It can use tools and data.
It can take action.
It can check the result and improve the next step.
In simple words, Agentic AI is AI that helps get work done.
Generative AI vs Agentic AI
Generative AI is mainly used to create content.
Agentic AI is mainly used to complete tasks.
Generative AI can help you:
Write emails
Summarise documents
Create reports
Generate ideas
Create images
Explain difficult topics
Translate text
Write code or formulas
Agentic AI can help you:
Read information from different sources
Decide what needs to happen next
Use apps, tools, and databases
Send replies
Update records
Create follow-up reminders
Route work to the right person
Continue a workflow with less manual effort
Comparison of Generative AI and Agentic AI
Simple Example of Agentic AI
Imagine a customer sends an enquiry about a course.
A normal AI tool can help you write a reply.
An Agentic AI workflow can do much more.
Read the customer enquiry
Understand what the customer wants
Check the correct course information
Draft a reply
Send the lead to the sales team
Update a spreadsheet or CRM
Create a follow-up reminder
This is not just content creation.
This is task automation with intelligence.
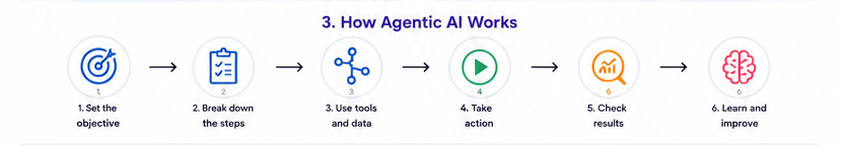
How Agentic AI Works
Most Agentic AI workflows follow a simple pattern.
How Agentic AI Works
Set the goal
Break down the steps
Use tools and data
Take action
Check the result
Learn and improve
The AI may use different tools during the process.
For example, it may read an email, search a document, update a spreadsheet, send a message, or create a report.
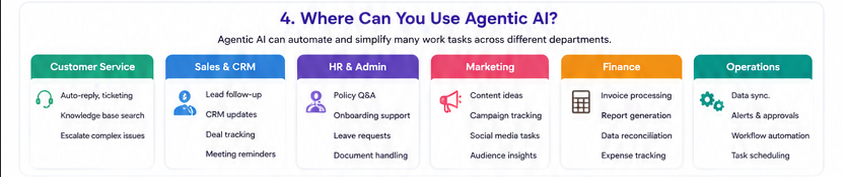
Where Can You Use Agentic AI at Work?
Agentic AI can be used in many departments.
Agentic AI Use Cases sor Sales, Marketing, Operations, HR
Customer Service
Answer common questions
Classify customer enquiries
Suggest replies
Escalate difficult cases
Search knowledge bases
Sales and CRM
Handle new leads
Prepare follow-up emails
Update CRM records
Track customer conversations
Remind sales staff to follow up
HR and Admin
Answer staff policy questions
Prepare onboarding checklists
Summarise resumes
Handle leave or document requests
Route requests to the right person
Marketing
Create campaign ideas
Draft social media posts
Prepare email campaigns
Summarise customer feedback
Analyse campaign responses
Finance and Operations
Extract invoice details
Prepare simple reports
Check data from spreadsheets
Send reminders
Track approvals
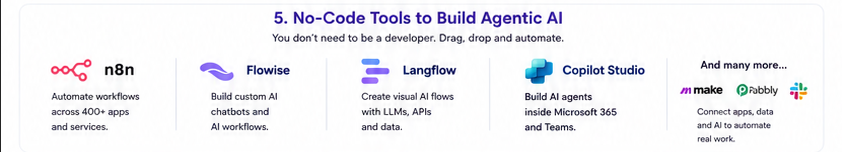
No-Code Tools to Build Agentic AI
No code tools for Agentic AI including n8n Flowise Langflow and Copilot Studio
You do not always need to be a programmer.
Many Agentic AI tools now use drag-and-drop interfaces.
You can connect apps, AI models, documents, forms, emails, and databases visually.
n8n
n8n is a workflow automation tool.
You can use it to connect apps and build AI-powered automations.
Flowise
Flowise is a visual tool for building AI chatbots, AI agents, and LLM workflows.
Langflow
Langflow helps users build AI applications and agent workflows using a visual interface.
Microsoft Copilot Studio
Copilot Studio helps organisations create AI agents for Microsoft 365, Teams, SharePoint, websites, and business workflows.
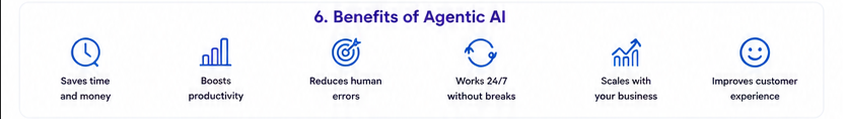
Benefits of Agentic AI
Benefits of Agentic AI
Saves time
Reduces repeated manual work
Improves response speed
Helps staff focus on higher-value tasks
Reduces copying and pasting between systems
Improves customer experience
Supports 24/7 workflows
Can scale as your business grows
Benefits of Generative AI
Generative AI is still very useful.
It is excellent for content, communication, research, and idea generation.
Helps you write faster
Improves email quality
Summarises long documents
Explains complex topics
Creates first drafts
Helps with brainstorming
Supports learning and training
So Which One Should You Learn?
You should learn both.
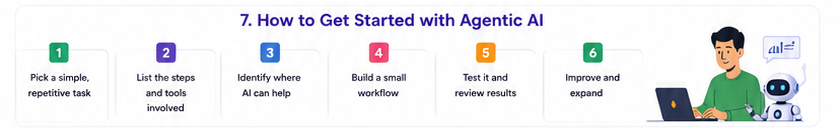
How to Get Started With Agentic Ai
Generative AI helps you create better content.
Agentic AI helps you build smarter workflows.
Together, they can improve productivity in almost every job role.
How to Get Started with Agentic AI
Pick one repeated task
Write down the steps
List the tools involved
Decide where AI can help
Build a small workflow
Test it carefully
Improve it step by step
Good First Projects for Beginners
Email enquiry assistant
FAQ chatbot
Document summary assistant
Lead follow-up workflow
Training feedback analyser
Simple report generator
Customer support triage bot
HR policy assistant
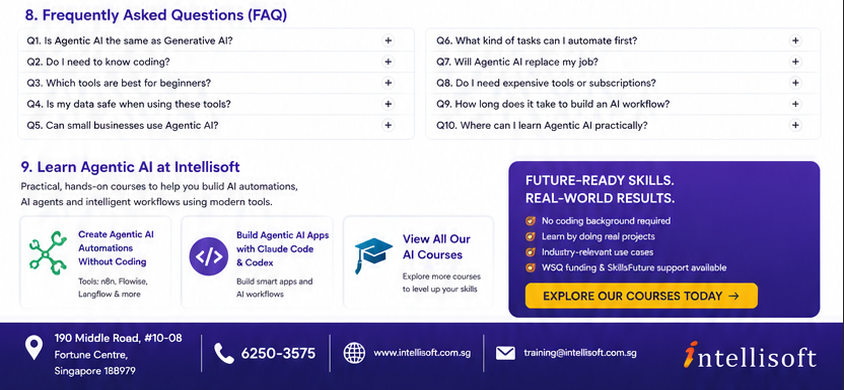
Frequently Asked Questions About Agentic AI
Frequently Asked QUestions About Agentic AI
1. Is Agentic AI the same as Generative AI?
No. Generative AI creates content. Agentic AI plans and completes tasks using tools and workflows.
2. Do I need to know coding?
Not always. Many tools such as n8n, Flowise, Langflow, and Copilot Studio use visual drag-and-drop interfaces.
3. Is Agentic AI only for IT people?
No. Business users, managers, HR teams, sales teams, marketing teams, trainers, and administrators can also use it.
4. What is the easiest way to start?
Start with one repeated task. For example, handling enquiries, summarising documents, or sending follow-up reminders.
5. Can Agentic AI replace employees?
Agentic AI is best used to support employees. It can handle repeated tasks so people can focus on judgement, creativity, service, and decision-making.
6. Is Agentic AI safe to use?
It depends on how it is set up. You should control access to data, check outputs, review permissions, and test workflows before using them in real business processes.
7. Can small businesses use Agentic AI?
Yes. Small businesses can use Agentic AI for enquiries, admin work, marketing, customer support, reporting, and follow-up tasks.
8. What tools should beginners learn first?
Good beginner tools include ChatGPT or Copilot for Generative AI, and n8n, Flowise, Langflow, or Copilot Studio for Agentic AI workflows.
9. How long does it take to build a simple AI workflow?
A simple workflow can be built in a few hours once you understand the tool. More advanced workflows need more planning, testing, and improvement.
10. What kind of tasks should I not automate immediately?
Do not start with high-risk tasks such as legal decisions, medical advice, financial approvals, or sensitive HR decisions. Start with low-risk support tasks first.
11. Can Agentic AI connect to Excel, email, forms, and CRM systems?
Yes. Many automation tools can connect to email, spreadsheets, forms, CRM systems, databases, and websites.
12. What is the main benefit of learning Agentic AI now?
You can understand how AI is moving from simple answering to real workflow automation. This helps you stay relevant and productive at work.
Learn Agentic AI at Intellisoft
At Intellisoft, we conduct practical AI courses for working professionals.
Our courses are hands-on and beginner-friendly.
You will learn how to use AI tools for real work situations.
You can explore courses on no-code Agentic AI, n8n, Flowise, Copilot Studio, Claude Code, Codex, and other modern AI tools.
Artificial Intelligence is evolving rapidly. While many people are getting more familiar with tools such as ChatGPT, Claude, Gemini, and Microsoft Copilot, the next major advancement is already here: Agentic AI.
Unlike traditional AI chatbots that simply answer questions, Agentic AI systems can plan, reason, take actions, access data, interact with applications, and complete complex tasks with minimal human intervention.
As businesses across Singapore and around the world begin adopting AI agents to improve productivity and automate work, many professionals are asking:
“Should I learn No-Code Agentic AI or AI-assisted coding with Claude Code or Codex?”
The answer depends largely on your role, technical background, and career goals.
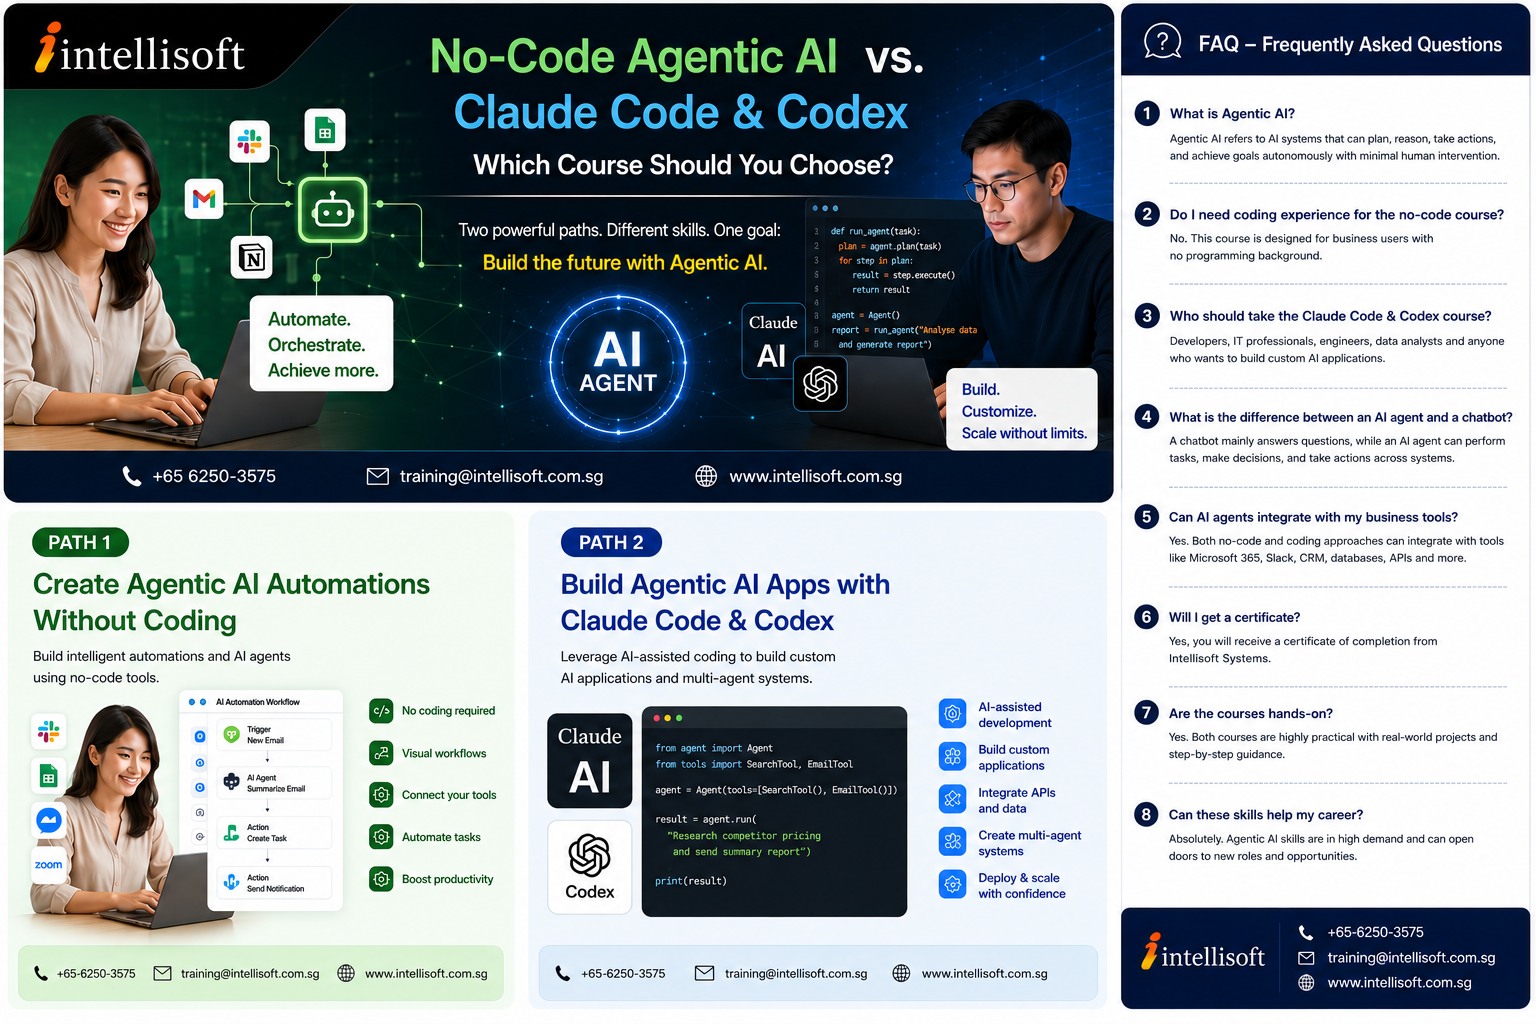
Intellisoft Agentic AI Course Comparison with Claude Code Course in Singapore
In this article, we explore the differences between these two exciting areas of AI and help you decide which learning path is best for you.
Understanding Agentic AI
Before comparing the two courses, it is important to understand what Agentic AI actually means.
Traditional AI systems are reactive. You ask a question and receive an answer. Agentic AI goes much further.
An AI agent can:
Understand objectives
Break complex goals into smaller tasks
Access information from multiple sources
Make decisions based on available data
Execute actions
Monitor outcomes
Adjust its behavior to achieve a desired result
For example, an AI agent could:
Monitor incoming emails
Extract important information
Generate reports
Create follow-up tasks
Send notifications
Update databases
Escalate exceptions to managers
—all without requiring constant human intervention.
This is why Agentic AI is becoming one of the most important workplace technologies of the decade.
Two Different Paths into Agentic AI
Although both courses focus on Agentic AI, they approach the technology from different perspectives.
This course is designed for business professionals who want to leverage AI without learning software development. We will be using no code and low code, drag and drop interface to build AI Automations. The software often used in our Agentic AI classes in Singapore are n8n, Copilot Studio, Flowise, AgentX, and LangFlow etc. Check out a comparison of n8n, Flowise & Langflow as Agentic AI Platforms.
No-code AI platforms allow users to build AI-powered solutions using visual interfaces rather than traditional programming.
Instead of writing code, users:
Drag and drop components
Configure workflows visually
Connect applications
Build AI assistants
Create automations
The focus is on solving business problems quickly.
Examples include:
Automated customer service assistants
AI-powered knowledge bases
Employee support bots
HR onboarding assistants
Document processing workflows
Lead qualification systems
Marketing automation agents
Skills You Will Learn in the Agentic AI Course Without Coding
Participants will learn how to:
Understand Agentic AI Concepts: Learn how AI agents think, reason, and execute tasks.
Explore various No Code & Low Code Agentic AI Platforms like n8n, Copilot Studio, Flowise, AgentX etc.
Build AI Assistants: Create intelligent assistants capable of handling workplace tasks.
Create Workflow Automations: Automate repetitive business processes that consume valuable time. For example, processing PDF invoices and read unstructured data from them.
Build Knowledge-Based AI Systems: Allow AI to search company documents and answer questions accurately.
Connect Multiple Applications: Integrate AI with business tools and services like Gmail, Google Calendar, Notion, Sheets, Outlook, Internet and many more,
Design Business Solutions: Transform manual workflows into AI-powered processes.
Benefits of No-Code Agentic AI
Fast Learning Curve: Most participants can begin building useful solutions immediately.
No Technical Background Required: Suitable for beginners and non-technical professionals.
Immediate Workplace Applications: Participants can implement solutions directly in their departments.
Lower Development Costs: Business users can build solutions without hiring developers.
Increased Productivity: Routine tasks can be automated quickly.
Claude Code Training in Singapore at Intellisoft. Master Claude Code & Codex with WSQ and SkillsFuture Grants
Who Is This Agentic AI Coding Course For?
This Agentic AI code class is designed for professionals who want greater flexibility and control when building AI-powered solutions.
Ideal participants include:
IT Professionals, Developers, Engineers, Technical Consultants, Data Analysts,
Power Users, Solution Architects, Technology Enthusiasts
While prior programming experience can be helpful, modern AI coding assistants have significantly lowered the barriers to entry.
What Are Claude Code and Codex?
Anthropic’s Claude Code, and OpenAI’s Codex are AI coding assistants. They are revolutionizing the software development industry and are an overnight success!
Both these tools have come up with frontier models that can create agentic apps and websites within a few minutes to a few hours. Previously this would take several months to even see a prototype. Now you can see a fully functional prototype within minutes of prompting these AI Coding Agents.
Instead of manually writing every line of code, developers can now collaborate with AI.
Tools such as Claude Code and OpenAI Codex can:
Generate code
Debug applications
Explain programming concepts
Build complete software projects
Create APIs
Generate documentation
Improve software quality
These tools act as intelligent coding partners. Take note that both Anthropic’s Claude Code and OpenAI’s Codex are paid products and a subscription or API credits are required to use these AI Agents.
Why AI-Assisted Development Matters
Historically, building software required years of technical training. Today, AI-assisted development enables professionals to create sophisticated applications significantly faster.
Many organizations are already using AI coding tools to:
Accelerate development cycles
Reduce coding errors
Improve software quality
Increase developer productivity
Build prototypes rapidly
The future of software development is increasingly AI-assisted. Thus, it is important to learn this emerging skill at the earliest.
Don’t get left behind the Agentic AI train…
Skills You Will Learn in the Claude Code and Codex Course in Singapore at Intellisoft Training
In the 2 Day Claude & Codex Class, participants learn how to:
Install Claude Code & Codex for Agentic AI App Development: What to install, how to install it, software and hardware required.
Desktop vs Terminal: Working in the desktop vs working in the Terminal window
Use Claude Code Effectively: Generate, analyze, and improve code using AI.
Use OpenAI Codex: Leverage advanced AI coding capabilities to build applications.
Build Agentic Applications: Create AI-powered systems capable of planning and executing tasks.
Create Multi-Agent Solutions: Develop systems where multiple AI agents collaborate.
Integrate APIs: Connect applications to external services and data sources.
Rapidly Prototype Applications: Transform ideas into working software quickly.
Debug with AI: Identify and fix issues faster. How to provide Browser use, Tool Use, Debugging & Troubleshooting tools etc. to the Agents to assist you.
Deploy Real Solutions: Move beyond prototypes into production-ready applications.
Benefits of Learning Claude Code & Codex for Agentic AI App Development
Greater Flexibility: Build solutions that are difficult or impossible using no-code tools.
Higher Customization: Create exactly what your organization requires.
Advanced Integration Capabilities: Connect to virtually any system through APIs.
Future-Proof Skills: AI-assisted software development is becoming a highly sought-after skill.
Increased Career Opportunities: Professionals who understand AI-assisted development are increasingly valuable in today’s workforce.
No-Code Agentic AI vs Claude Code & Codex Coding Agents
Area
No-Code Agentic AI Platforms like
n8n, Flowise, Copilot Studio, Agentx
Claude Code & Codex AI Coding Agents
from Anthropic & Open AI
Coding Required
No
Basic understanding helpful
Learning Curve
Easier
Moderate
Target Audience
Business Users, AI enthusiasts,
anyone interested in building own
chatbots
Business users wanting to build own apps without actual coding,
& Technical Users
Build AI Chatbots
Yes
Yes
Build AI Agents
Yes
Yes
Build Workflow Automation
Yes
Yes
Build Custom Applications
Limited
Extensive
API Integration
Basic
Advanced
Technical Flexibility
Low
Low to Medium
Career Path
Business Automation
Business Innovation & AI Development
Which Agentic AI Course Should You Choose?
Choose Create Agentic AI Automations Without Coding If:
You are a business user.
You want quick results.
You prefer visual tools.
You need departmental automation.
You do not want to learn programming.
This course is ideal for professionals seeking immediate productivity improvements.
Choose Build Agentic AI Apps with Claude Code & Codex If:
You enjoy technology.
You want to create custom AI solutions.
You want to build tight integrations with multiple diverse systems and platforms and go beyond simple automation.
You want to learn AI-assisted development.
You are preparing for future technical roles.
This course provides deeper technical capabilities and greater flexibility.
Why Learn Agentic AI Now?
Industry experts believe Agentic AI will become one of the most transformative technologies of the next decade.
In Singapore, most government, multi national and even small and medium organizations are already exploring how Agentic AI can help their teams. They want more productivity and automation at a reduced cost.
AI-powered customer service
Autonomous business workflows
AI research assistants
Knowledge management systems
Intelligent document processing
Automated reporting systems
AI-powered software development
Professionals who learn these skills early will be better positioned to lead AI adoption within their organizations.
Learn Agentic AI with Intellisoft Training
At Intellisoft Training, our Agentic AI programs are designed to be highly practical and hands-on.
Participants will work with real-world scenarios, build AI-powered solutions, and learn practical techniques that can be applied immediately at work.
Ideal for professionals who want to leverage AI-assisted coding to build advanced AI applications and automation solutions.
Both programs are conducted by experienced trainers and include demonstrations, guided exercises, and practical business use cases.
Frequently Asked Questions About Agentic AI, No-Code AI Automation, Claude Code & Codex
1. What exactly is Agentic AI, and how is it different from ChatGPT or traditional AI chatbots?
Most people are familiar with AI chatbots such as ChatGPT, Claude, Gemini, or Microsoft Copilot. These tools are excellent at answering questions, generating content, and providing recommendations.
Agentic AI goes a significant step further.
Instead of simply responding to prompts, Agentic AI systems can reason through complex objectives, create plans, break tasks into smaller steps, use tools, access external information, make decisions, and execute actions with minimal human intervention.
For example, a traditional chatbot may help draft an email. An AI agent could monitor incoming emails, identify urgent requests, generate responses, create tasks, update a CRM system, and notify relevant staff members automatically.
In short, chatbots answer questions. Agentic AI systems complete objectives.
2. Is Agentic AI just another buzzword, or is it genuinely changing how businesses operate?
Agentic AI represents one of the most important developments in artificial intelligence since the rise of large language models (LLMs)
Many organizations have already moved beyond simple chatbots and are deploying AI agents for:
Customer support,
HR onboarding,
Employee self-service,
Sales qualification,
Document processing,
IT support,
Business intelligence, and
Workflow automation
Industry analysts predict that future workplaces will increasingly consist of humans collaborating with AI agents that handle repetitive, time-consuming, and data-intensive tasks. Professionals who understand how AI agents work will be better positioned to lead digital transformation initiatives within their organizations.
3. What is the difference between an AI assistant, an AI chatbot, and an AI agent?
Although these terms are often used interchangeably, they are not identical.
An AI assistant generally helps users perform tasks such as writing, summarizing, or answering questions.
An AI chatbot focuses primarily on conversational interactions.
An AI agent can perform autonomous actions, make decisions, use tools, interact with systems, and work toward achieving specific goals.
Think of it this way:
AI Assistant = Helps you
AI Chatbot = Talks to you
AI Agent = Works for you
As AI technology evolves, these categories increasingly overlap, but the distinction remains useful when evaluating AI solutions.
4. Can someone with no programming experience really build useful AI agents?
Absolutely! Modern no-code and low-code platforms have dramatically lowered the barriers to entry.
Business users can now create:
AI-powered knowledge assistants
Customer support agents
Lead qualification systems
Internal employee help desks
Automated reporting solutions
Workflow automations
Many organizations are finding that business users often understand operational requirements better than developers. No-code tools enable subject matter experts to build solutions themselves without waiting for IT resources.
This is precisely why no-code Agentic AI is growing so rapidly.
5. What are the limitations of no-code Agentic AI platforms?
While no-code platforms are powerful, they are not suitable for every situation.
Common limitations include:
Restricted customization options
Platform-specific constraints
Limited access to advanced programming features
Vendor dependency
Higher costs at scale
Less flexibility for highly specialized applications
For many business use cases, these limitations are acceptable. However, organizations requiring sophisticated integrations or custom functionality may eventually need coded solutions.
This is where Claude Code and Codex become valuable.
6. What exactly are Claude Code and OpenAI Codex?
Claude Code and OpenAI Codex are AI-powered software development assistants.
They allow developers and technical users to describe what they want in natural language and have AI generate, modify, explain, and debug software code.
For example, a user might type:
“Create a web application that extracts information from PDF invoices and stores the results in a database.”
The AI can generate much of the required code, architecture, and implementation guidance. This dramatically accelerates software development and allows individuals to build sophisticated solutions faster than ever before.
7. Will AI coding tools replace software developers?
This is one of the most frequently asked questions in the technology industry.
The short answer is NO. However, developers who effectively use AI will likely outperform those who do not.
AI coding assistants can generate code quickly, but they still require human oversight for:
Architecture design
Security reviews
Performance optimization
Business requirements
Quality assurance
Governance and compliance
The future is not AI replacing developers. The future is developers working alongside AI to become significantly more productive.
8. What kinds of applications can be built using Claude Code and Codex?
The possibilities of applying Agentic AI Coding agents are extensive.
Examples include:
AI-powered web applications,
Internal company tools,
Customer service platforms,
Knowledge management systems,
Business intelligence dashboards,
AI chatbots,
Document processing systems,
Workflow automation platforms,
API integrations,
Multi-agent systems,
Many applications that previously required months of development can now be prototyped in days or even hours.
9. What is a Multi-Agent System?
A Multi-Agent System consists of multiple AI agents working together to solve complex problems.
For example:
A customer support solution might involve:
A triage agent
A research agent
A document retrieval agent
A reporting agent
A quality assurance agent
Each agent performs a specialized role while collaborating toward a shared objective.
Many experts believe multi-agent architectures represent the next major stage of enterprise AI adoption.
10. What is Retrieval-Augmented Generation (RAG), and why is it important?
One of the biggest challenges with AI systems is ensuring they provide accurate and up-to-date information.
RAG addresses this problem by allowing AI models to retrieve information from trusted sources before generating responses.
Instead of relying solely on training data, a RAG system can search:
Internal documents
Knowledge bases
Policies
Standard operating procedures
Product documentation
This makes enterprise AI systems significantly more accurate, reliable, and useful.
Many modern AI agents are built using RAG architectures.
11. How do AI agents connect to business systems such as SharePoint, CRM platforms, ERP systems, or databases?
AI agents can interact with business systems through APIs, connectors, databases, and workflow platforms.
Depending on the solution, an AI agent can:
Read data
Create records
Update information
Trigger workflows
Send notifications
Generate reports
Examples include integrating with:
Microsoft 365
SharePoint
Salesforce
HubSpot
SAP
Oracle
Dynamics 365
SQL Databases
Cloud storage systems
These integrations allow AI agents to move beyond conversations and become active participants in business processes.
12. Are AI agents secure enough for enterprise environments?
Security is one of the most important considerations when deploying AI solutions.
Modern enterprise AI platforms offer features such as:
Role-based access controls
Encryption
Audit logging
Data governance
Private knowledge repositories
Compliance monitoring
Organizations should establish clear AI governance policies and ensure sensitive information is handled appropriately.
Security is not purely a technology issue—it also involves processes, policies, and user training.
13. Which course is better for my career: No-Code Agentic AI Class or Claude Code & Codex Class in Singapore?
Both of these courses are extremely valuable, but they support different career paths.
No-Code Agentic AI is ideal for:
Managers
Business analysts
HR professionals
Finance staff
Operations teams
Customer service leaders
Claude Code & Codex is ideal for:
Developers
Engineers
Technical consultants
IT professionals
Data analysts
Business users typically benefit more from learning how to automate processes, while technical professionals benefit more from learning how to build custom AI-powered applications.
14. What skills will be most valuable in the age of Agentic AI?
The most successful professionals will combine domain expertise with AI literacy.
Important future skills include:
Prompt engineering
AI workflow design
Process automation
AI governance
Data literacy
Critical thinking
Human-AI collaboration
AI solution architecture
Understanding how to effectively work with AI agents may become as important as learning Microsoft Office was in previous decades.
15. Where is Agentic AI heading in the next five years?
The next generation of AI systems will likely become increasingly autonomous, collaborative, and specialized.
We can expect to see:
Teams of AI agents working together
Department-specific AI employees
AI-driven business operations
Autonomous software development
Personalized enterprise assistants
Continuous AI monitoring and optimization
Organizations that begin learning and experimenting with Agentic AI today will be far better prepared for this future than those who wait.
For professionals, the question is no longer whether AI agents will impact their work—it is how quickly they can learn to use them effectively.
Ready to explore the future of AI automation?
Whether you want to build powerful AI workflows without coding or develop advanced AI applications using Claude Code and Codex, now is the perfect time to start your Agentic AI journey with Intellisoft Training.
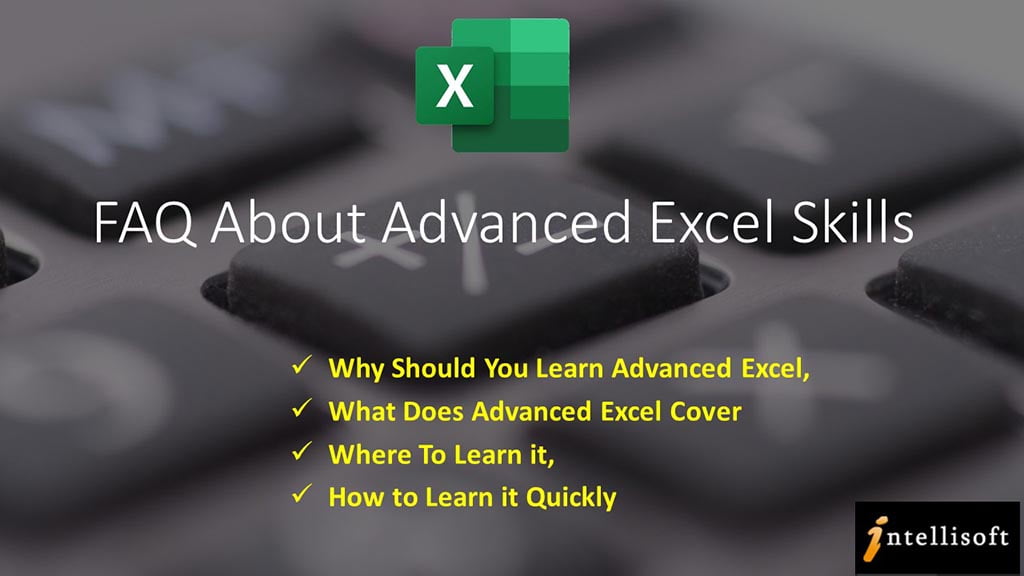
Advanced Excel FAQ:
What is Advanced Excel, Why should you learn it, How to learn Advanced Excel in Singapore
– A Fast Start Guide to Becoming an Expert at Advanced Excel Skills
Every organization uses Microsoft Excel in their day to day work. Most employees & managers know Excel to some extent. And they are able to survive the day by doing things in one way or another… often the long and inefficient way.
Learning to use Microsoft Excel well goes beyond the basics. That’s where the Advanced Excel skills come in handy.
Microsoft has bundled in hundreds of useful functions and features, that can do wonders, save a lot of time, and improve your efficiency & productivity.
Each new version of Excel is packed with ever richer functionality, and provides more ways to use Excel to its utmost at any workplace.
Microsoft is striving to add those features that can simplify complex things, and make it easier to do data entry, perform computations, and even analyze data & present the insights into actionable information useful for clients and colleagues or the management in nicely created reports and dashboards.
So how come very few people are familiar with these Advanced Excel Features & Functions?
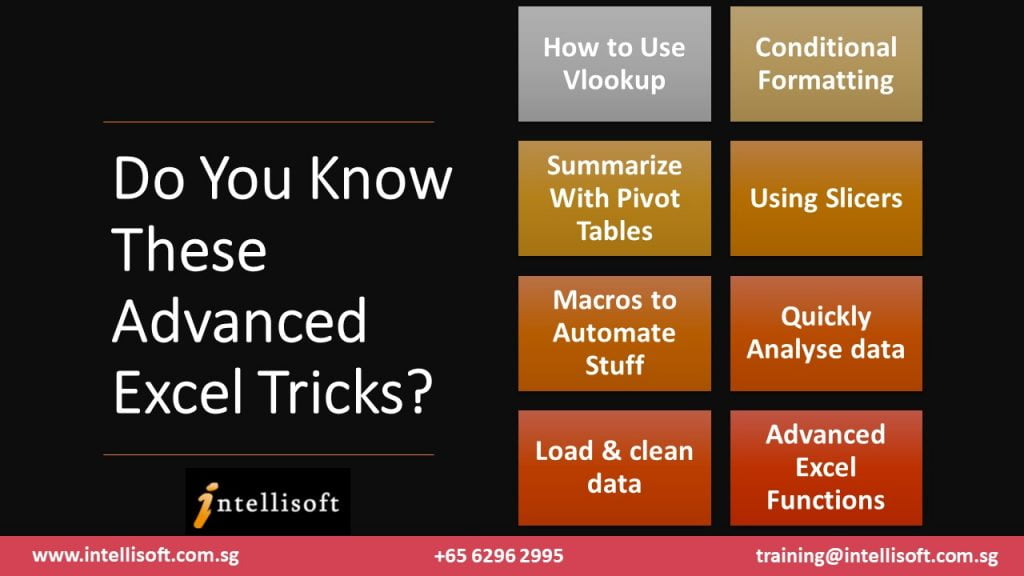
Do You Know These Advanced Excel Tricks?
Partly because Microsoft is a software company, and not so much an education company. They add new Excel formulas, features, shortcuts, buttons, charts types, and options, but Microsoft doesn’t spend the time in educating everyone about these new enhancements in the time they deserve.
Microsoft simply blog about it, updates the documentation, and then wait for you to figure it how somehow. Most greatly useful features languish, forgotten in the documentation, hardly ever used…
Also, partly to blame is our education system, which does not start teaching us the key Excel skills that are essential in the job. Almost every student now works on a laptop or a tablet, using documents & spreadsheets for every report, presentation or assignment they do. But our schools often leave you to figure how to be productive with these basic tools.
Very few schools or colleges have mandatory Excel or Word Training. It’s no wonder that when a fresh graduate joins the workforce, they often take ages to do simple things, stumbling and faltering along their journey to do even basic things in Excel, let alone the Advanced Excel Techniques that are required to be productive.
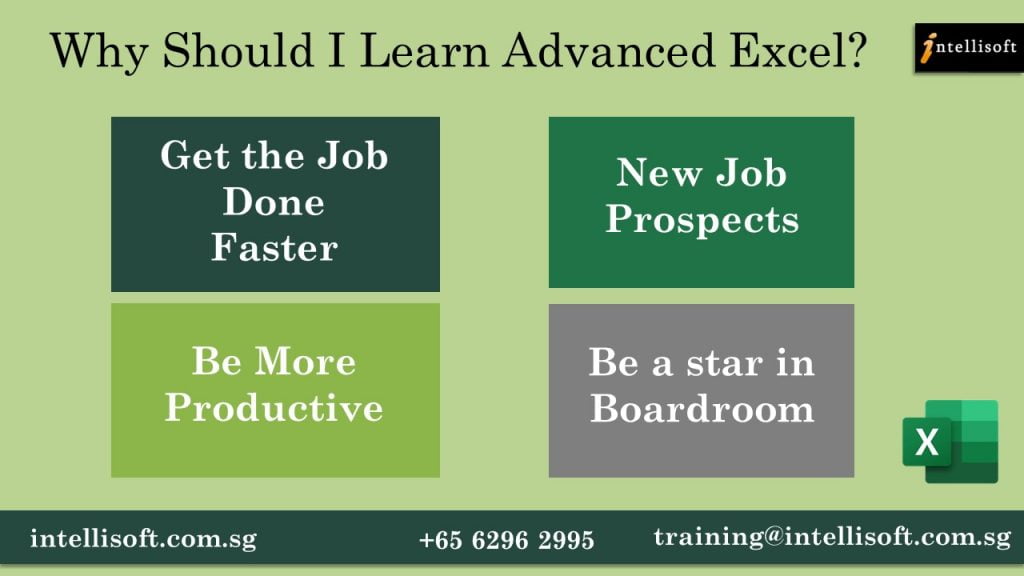
Why Should I learn Advanced Excel?
That’s a common question for people using Excel at workplace. If you don’t even know what Excel can do, why will you be interested in learning it. You need to see the features to believe it, and to see your own blind spots.
Do You Know These Advanced Excel Tricks?
Increased Productivity With Advanced Excel Tips & Tricks
If you care about getting the job done faster, without any errors, then it is in your interest to improve your competence in Excel. You don’t have to learn all the 500 plus functions to master Excel. In fact, you can already be more productive if we can know and use more than 10-15% of the Advanced Excel features and functions we have listed below.
Better Job Prospects With Better Excel Skills
New job prospects & Career switch options also open up for those who can manipulate and juggle data easily in Excel. Many higher end analyst jobs in the financial and accounting, sales, marketing, management & consultancy areas require good analytical & decision making skills.
Better Presentations With Excel Charts, Reports & Dashboards
Plus, With Advanced Excel Charts & Reporting features, you can be a star in the boardroom too. Most client presentations will need some amount of data and analysis to be presented, which can easily be analyzed and tabulated in Microsoft Excel, provided you know how to do it quickly.
So now you know the key reasons why you should learn Advanced Excel, you may be wondering, what are the key features of Excel that can considered as “Advanced“.
What Really Are Advanced Excel Skills?
Knowledge of multiple useful features and functions, plus the ability to use them at short notice is what we can call as Advanced Excel skills. To name a few, you must be able to know and perform the following things in Excel well.
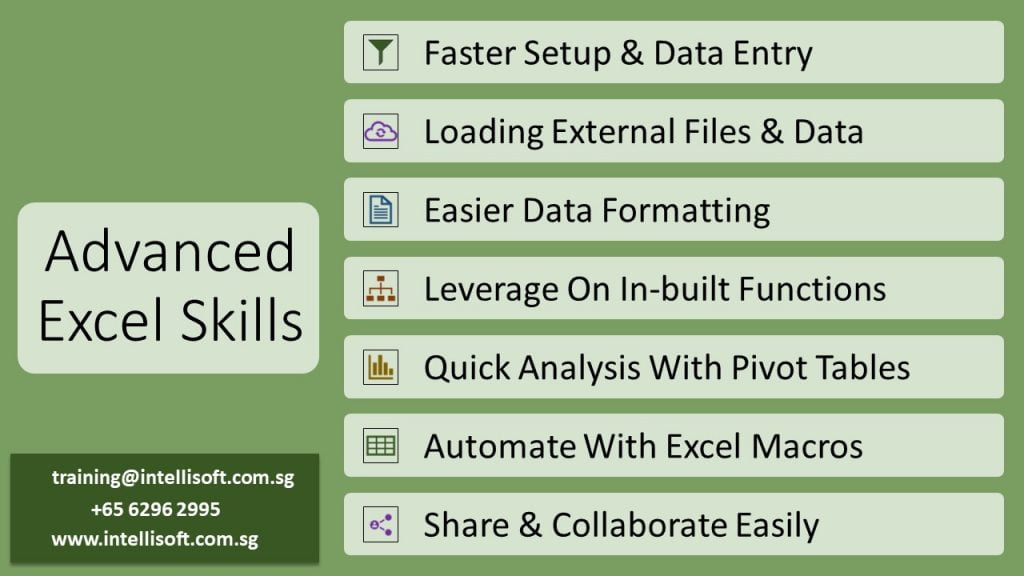
A Listing of Key Excel Skills You Must Have
FASTER SETUP & DATA ENTRY WITHIN EXCEL
Setup Columns Quickly using Auto fill options. For example, you can fill Months or Quarters easily by filling in just the first value. Similarly, you can generate sequence numbers from any starting point to any ending number.
Do Quicker Data Entry by using Auto complete of repeating values as Excel picks up the filling values using pattern recognition
Generate Sequence Numbers quickly With Auto Fill & Flash Fill options
LOADING EXTERNAL FILES & DATA
You must be able to Bring External data into Excel from any kind of source – be it Text files, CSV files, XML, Web Data or Database files. Plus, Excel now makes it easier to bring in data from the Cloud Apps like SalesForce, Zendesk, QuickBooks & over 200 app integrations, from Power Query, now built into Excel, from version 2013 onwards.
All is not good just by loading the data. You will have to clean & de-duplicate it. Fill in blanks, handle null or missing values, and then fix the dates to become useable. You’ve often got to convert dates formatted as YYYYMMDD or DDMMYY into something that’s more humane – DD-MMM-YY or MM/DD/YY. Obviously the actual settings will depend on your country, regional settings & preferences. But it is often required. This requires you to use Power Query, or use Text functions to extract the date, month or year from strangely formatted dates.
EASIER DATA FORMATTING
After cleaning the data comes the job of making it easier to read and identify the key data points.
Here comes the Data Formatting options. Formatting Data makes it easier to read and present data. With Conditional formatting options, it is easier to highlight data based on any simple or complex condition or criteria. By highlighting data, you can make it easy to the winners and losers & spot issues and errors. Highlight the highest values, lowest values, values between a range, values outside a range, or set up your own rules, based on calculations.
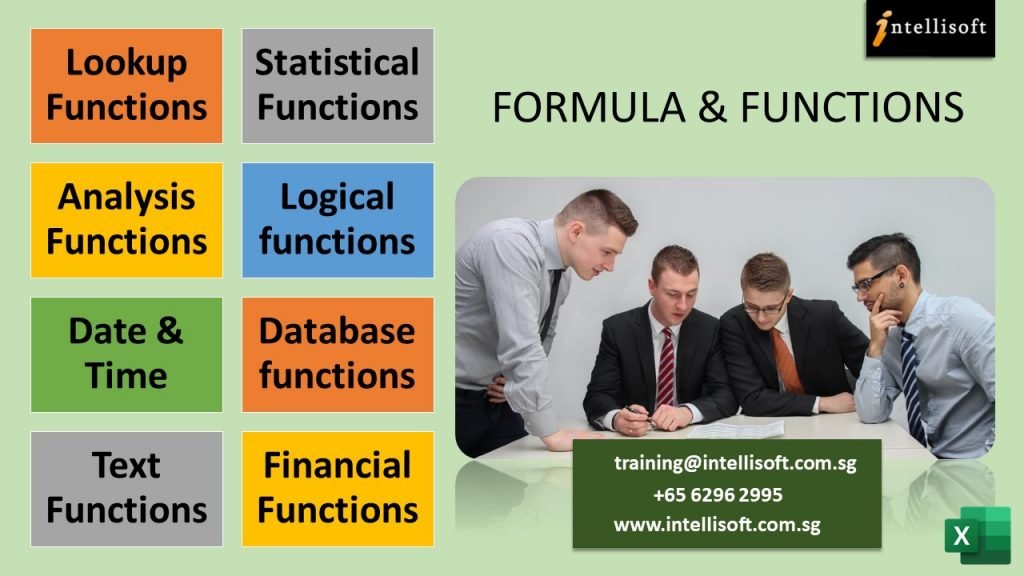
LEVERAGE ON IN-BUILT EXCEL FUNCTIONS
Good knowledge of Advanced Excel Functions is essential to get more mileage out of Excel. Microsoft’s Excel functions are divided into multiple categories:
Categories of Microsoft Excel Functions
Lookup Functions like VLookup, Index, Match, Offset, Indirect allow you to find anything from within Excel tables and Master data. Pick the employees name based on Code, or find out who secured the highest or lowest sales numbers.
Statistical Functions like Median, Mode, Standard Deviation, Variance allow you to analyze data statistically. You can find out the median, standard deviation or variance, allowing you better insights into the data as to what happened, why it happened, and what is most likely going to happen.
Analysis Functions like Correlation & Regression, Trend Analysis & Forecasting further the statistical functions into forecasting, and allowing you to make better projections, and better decisions based on the happening trends.
Excel Formula Groups
Logical functions like IF, SUMIF, COUNTIF, IFERROR allow you do things conditionally – check if a condition is met, add or count based on conditions being met or not met, and even check and handle errors from happening.
Date & Time functions for finding todays date, time, difference between dates, hours, year, month, days, weekdays. This allows you to do time based calculations, buckets of date ranges, and even create ageing analysis based on range values.
Database functions that treat the entire data set as a database, and allow you to aggregate results using DSUM, DAVERAGE, DMAX, DSTDEV. This can be useful when working with big data
Text Functions to extract, clean and manipulate data – Left, Right, Mid, Char, Len, Fixed, Trim, TextJoin help in fixing erroneous data, and picking certain batch codes, lot numbers, region or product codes from within serial numbers.
Financial Functions like PV, NPV, PMT, IRR, Accrued Interest, Future Value, Mirr etc. are useful for analyzing the current, present and future value of things. Interest calculation, accruals, monthly installments, interest rates etc. can be easily worked out by using these advanced Financial functions of Excel.
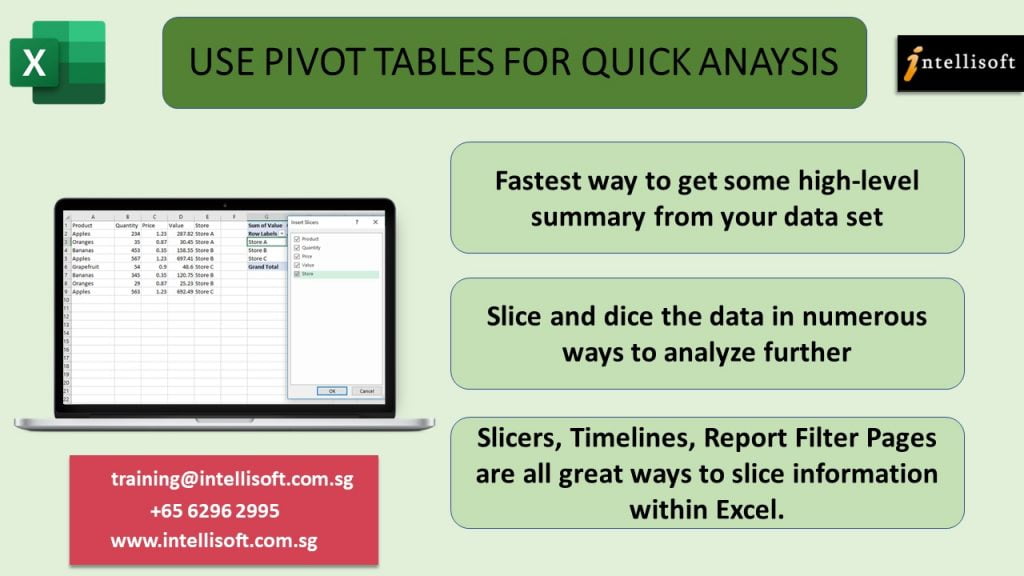
PIVOT TABLES FOR QUICK ANAYSIS
Use the Pivot Table feature of Microsoft Excel, which is the fastest way to get some high level summary from your data set. Pivots allow you to slice and dice the data in numerous ways, and analyze it using different dimensions easily, without writing any formulas or macros. A pivot table is the first thing people turn to when they want some quick analysis or summary on the data.
With the help of Slicers, Timelines, Report Filter Pages, you can look at the same data in multiple ways, multiple dimensions, and in multiple filter flavors.
These are all great ways to analyze information quickly with Excel – a strong reason to learn Advanced Pivot Table techniques of Microsoft Excel.
Use Pivot Tables For Quicker Analysis of Data
In fact, knowledge of Pivot tables is often tested in interview questions for jobs requiring a good amount of business analytics. Even in days where most companies world class ERP software with hundreds of canned reports, often raw data is extracted from these ERP packages and combined with external market data, manual forecasts and then analyzed using Pivots.
Competence in Advanced Pivot Table analysis techniques are are must if you want to get into business analytics. Strangely, for the amazing things pivots can do, they are surprisingly easy to master. I often see managers and senior executives surprised at the simplicity, and lament that they missed out on this easy feature for the past several years, relying on junior executives to churn out the reports.
No harm in getting the ground staff to run the reports, but sometimes they do not have the acumen or sensory acuity of understanding the big picture. The juniors often report the obvious, without being able to get that helicopter view of the data.
Pivots are the easy, low hanging fruit that you should begin with, for it brings the biggest bang for the buck. You can easily master it in an afternoon, or in a pivot table masterclass and win an edge with this winning Advanced Excel trick up your sleeve.
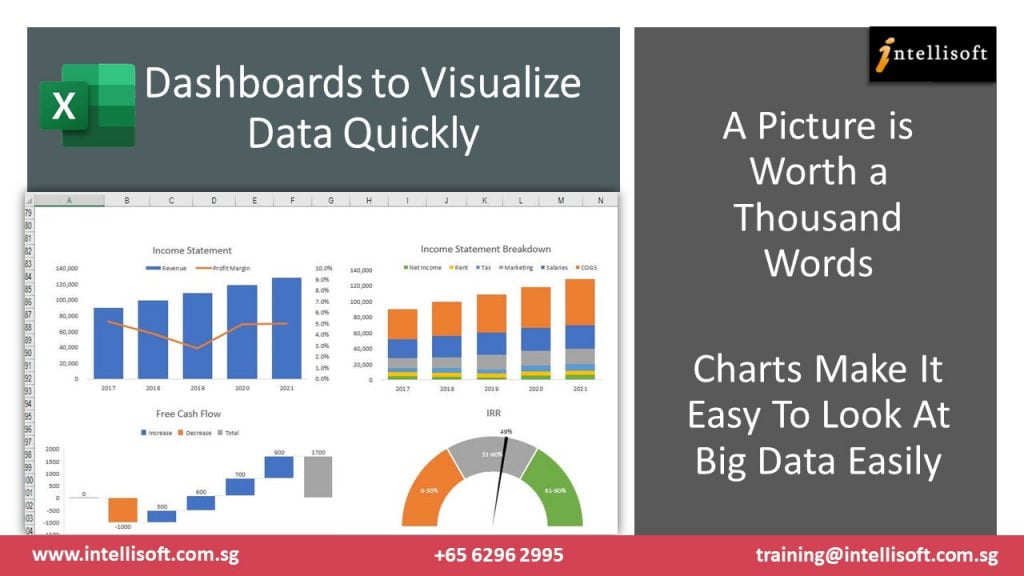
CHARTS TO VISUALIZE INFORMATION
Excel Dashboards To Visualize Information Quickly
Create Charts from raw or summarized data to visualize the information quickly. Multiple columns and thousands of rows make it very difficult to see the big picture and spot a trend.
How To Convert Excel Data into Charts
A visual is worth a thousand words. An Excel chart can depict the past sales of many months or quarters, returned products or problem tickets created/solved each month, and it becomes much easier to spot a trend by looking at a high level chart more than by looking at a sea of rows and columns
There are multiple kinds of charts in Excel that can make boring data look stunning. Choose from Bar & Column charts, Pie & Donuts charts, Waterfall charts or Line Charts. You can also create combination charts showing column and lines at the same time, allowing you to measure 2 different metrics at one time.
Excel charts are easy to master, and there’s a lot to choose from. You can easily format them, add legend, titles, colors, and just about tweak every aspect with a mouse click. Mastering such Excel Charting tips can take you far in the boardroom, with better looking charts & visuals.
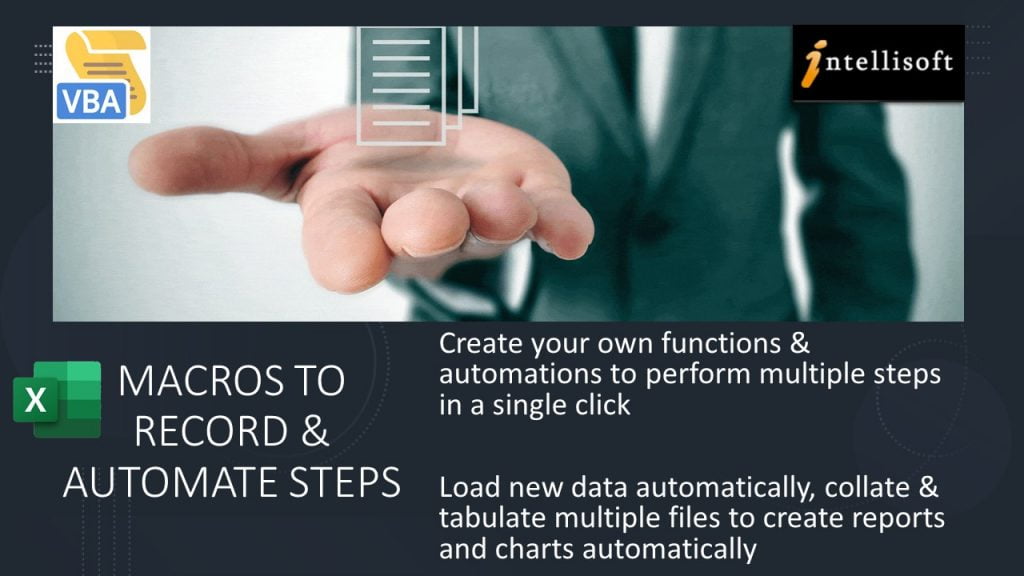
MACROS IN EXCEL TO RECORD & AUTOMATE STEPS
Macros are the one Advanced Excel Feature that allows you to extend Microsoft’s products and take them to newer heights. You can create your own functions & automations in Excel to perform multiple steps in a short time, at a single button click.
Macros are heavily used in Banks, financial institution, and in accounts departments of almost each and every company. They are the staple of the data enthusiasts who like to do things just once.
Excel VBA Macros allow you to load new data automatically each month, collate and tabulate multiple sheets & multiple workbooks, and create reports & charts automatically for each new period.
Macros are recorded or written and edited in a special language created by Microsoft – Visual Basic for Applications (VBA) in short.
While learning VBA may take some time, this is the secret weapon that separates the wizards of Excel from the amateurs. Once an Excel macro is written and tested, it can easily be deployed to the masses. Your colleagues and users needn’t know the complexities or the logic of how things are done.
Macros Automate Routines & Execute Faster
For example, you could create your own custom Financial Accounting Software, just by using Excel. Using Forms, you can get the users to key in the sales, expenses, and generate invoices or receipts at a click. And a Cash Flow Statement, a Profit & Loss Statement, or a Balance Sheet could be generated at any time, collating all the data keyed in so far.
This allows the users to get more done with Excel, and everyone doesn’t have to learn the technicalities of generating such reports at any time.
VBA Macro writing and editing skills are considered Advanced, because it requires you to learn the specific way Excel refers objects like workbooks, sheets, rows and columns. VBA is a full blown programming language – allowing you to write loops, conditions, procedures, functions, and tag them to buttons, mouse movements etc.
This one advanced Excel skills can make you indispensable in the whole department. I have known several people who have a clout in the company because of their deep knowledge of the system, and that they have written the backend systems that the company uses in its day to day operations. Such deep knowledge is always in demand.
SHARING & PROTECTION OF DATA
Today Microsoft Excel is improved and enhanced to allow multiple colleagues and friends to work together on the same file. You can track changes of who did what, and you can even protect the information in such a way that only those authorized to see or edit can do so, protecting information from prying eyes.
Sharing & Protection Options in Excel
With Advanced Data Protection techniques in Microsoft Excel, you can hide sheets, write protect them to make them view only, or allow only certain rows, columns or cells to be editable. This gives a tremendous advantage while working with multiple people and multiple sheets.
With the integration of OneDrive, you can truly collaborate with your team, having multiple edits and track changes as they happen. It is much easier to edit, pick the changes you like, or remove/revoke changes that you do not approve of.
Share & Protect Data Accurately With Amazing options
If you haven’t visited the Review menu of Excel, you’d be surprised with the multiple options available under the hood, that allow for Collaboration, Sharing, Editing & Protection of Documents.
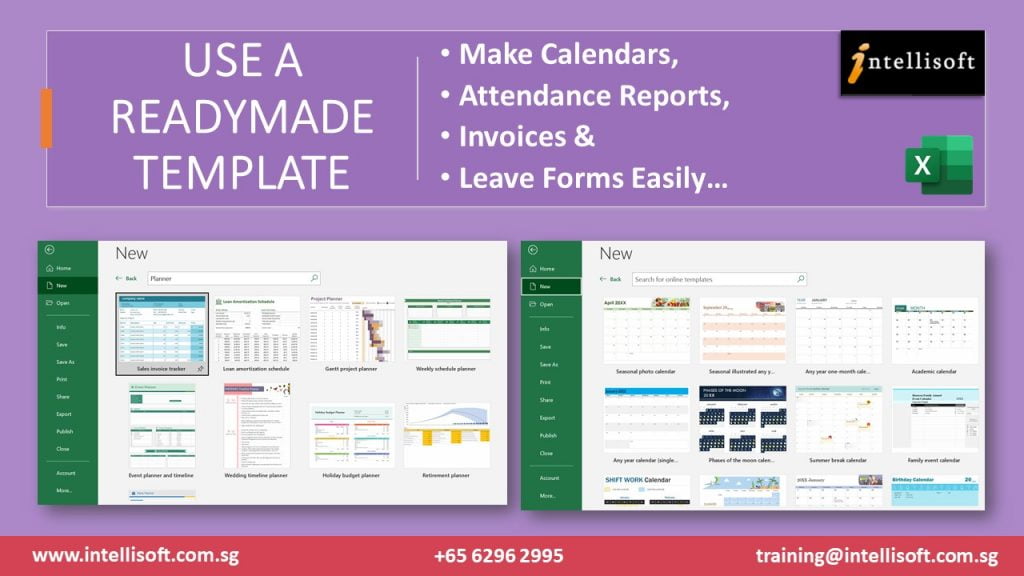
SIMPLE, COMPLEX, ADVANCED TEMPLATES
Almost everything you do in Excel has been done before. So if you are making a calendar, or a cash flow report, a monthly report, attendance report, Result of Students, Invoices or Statement of accounts, Expense claims or Employee Leave forms for the team, there is a ready made template to do so.
Not just one, you have hundreds of templates to choose from. These ready made templates are available to any Microsoft Office user to use and save time.
Save Time With Sophisticated Excel Templates
On top of this, you can create your own company wide or departmental templates, that can be used month after month, quarter after quarter without any changes. Consolidation becomes a breeze if you all use the same template.
Plus, tracking & merging of multiple changes can be done with the hidden Track & Merge option. You can’t find this button in the standard toolbar, and need to enable it separately. A golden gem of a function. Even seasoned pros have been unaware of this super cool advanced excel functionality.
Print Beautiful Reports & Charts With Advanced Excel Techniques of Page Setup
With Advanced Page setup, you can decide what you want printed and what not. You can add headers, footers, page numbers, logos etc. straight out of the box. But Excel goes beyond this into giving you fine control over the rows, columns, and area that will be printed.
Excel Page Setup Options
You can control whether you want to print grid lines, draft copy or are you printing the final copy. The current date or time can be printed too, along with a lot of meta data – file names, sheet names, page numbers etc. provide you with a fine control. Printing order – collated or by page, and auto fit to handle orphan printing of some columns can be a real paper saver.
Trees will love you for learning and using the page setup options within Excel well.
ADVANCED SORTING & FILTERING
Almost everyone figures out how to sort data on any column – in either ascending or descending order. But Excel allows you to perform custom formatting – based on your values, and your defined order.
Sorting for multiple, unlimited levels is a boon too. This breaks the limited 3 level sorting of previous versions, allowing you to sort as many levels as you please.
Filters have improved much in the past 10 years. Now you can easily filter the Top 10 or Bottom 10 values, filter by color, filter by values, and even filter by specific text or dates. There filter feature helps you to actually define the period of data or values that you want to focus on, and eliminate the rest. Master this simple feature, and get to your important data points quickly.
Filtering the values to focus on at any given time removes clutter and makes it easy to visualize information in Excel.
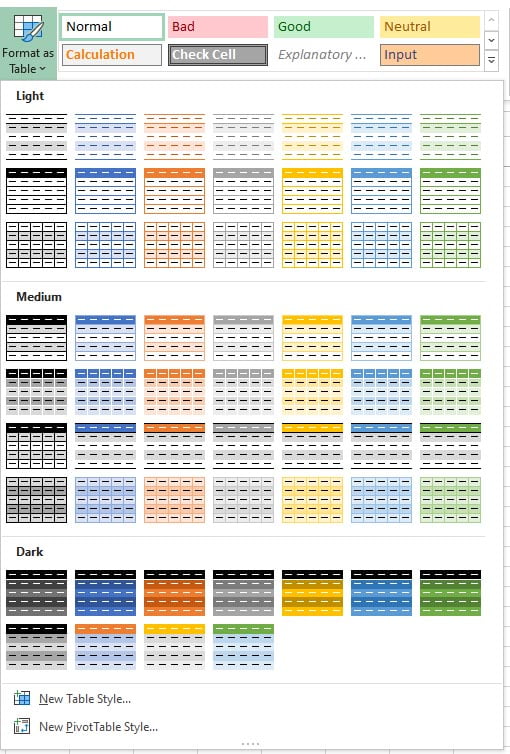
FORMATTING DATA INTO TABLES – A SUPER SIMPLE WAY TO ADD MAMMOTH FUNCTIONALITY, For Free!
Microsoft added the functionality to treat data as a table in Excel 2007. But the name they gave to the button that begins this functionality is a showstopper.
Format as Table in Excel
When you look at “Format As Table”, all you’ll see is multiple coloured data tables. And many an Excel enthusiasts pull away, thinking its just colors… They fail to learn the mammoth hidden functionality of Excel beneath this mis-labeled button.
But once you go over this hump, you are on your way to explore gold with Formatted Tables.
Since 2007, Excel Tables have come a long way. Now they have smart range names, auto fill and auto spill ranges, and use range names in calculations. There are several magic cells in Excel Tables, that can perform additional tasks too.
Becoming adept at using Table features of Excel will speed up your analysis.
Further, tables can be filtered, sorted, sliced. For date based data, you can add a Timeline, which is a slicer based of dates, but much better.
There you have it… These are just some of the advanced features of Excel. Learning about additional things like Custom Formatting, Range Naming, Working With multiple Worksheets, or combining data from multiple workbooks, consolidation, What-if analysis, Scenario Manager, Data Tables, Data Validation etc. will take your Advanced Excel knowledge to a much higher level. There is simply too much functionality to talk about in one article.
Suffice is to say that if you want to get done more, cheaper & faster, then learn some of these Advanced Excel Features, pronto!
How long does it take to learn excel?
There is no simple answer when you are beginning to learn a new skills. To learn Advanced Excel tricks is going to be the same too. It also depends on your interest, commitment, and the amount of time you are wiling to spend in learning it.
I would say that learning Advanced Excel tips and tricks is more of a journey.
You learn some concept, begin to apply it, and then learn some more. While learning, you will come across new concepts, see new problems, and seek newer ways to handle these challenges. This step by step approach will open your eyes, develop a keener sense of Excel capability, and develop your Excel muscle step by step, day by day!
I have been a student of Microsoft Excel for the past 30 years. And still I find new things, and new ways of doing the same things. It has been a fun and exciting journey and I love challenges in Excel.
Every once in a while, someone will send me a long and complex looking formula, and dissecting it, understanding it, and learning from it makes us all better. Helping others with their Excel has been one good way that has helped me grow my Excel competence.
Can you teach yourself Excel?
Yes, of course you can teach yourself Excel. And you can even learn Excel at home. All the same, I would recommend a step by step approach in self-learning of Advanced Excel . Based on your interest, it is safe to divide Excel Training into a few sections.
First begin with understanding Range Names, Conditional Formatting, Tables and Pivot Tables.
Then pick up more complex Logical & Lookup Functions to delve deeper.
After this, you can then focus on Financial or Statistical or Date Functions based on interest or usage within your organization.
No point in learning Excel for the sake of learning. You must apply it first. So find a challenging situation within your company or department, and seek to build a solution to fix it is a good way to get started in building your Excel muscles.
It is safe to say that if you begin learning Excel techniques by using this method, in 2-3 months you will see a big improvement in your understanding of Excel.
And in 6 months time you can be at a pretty advanced level in your Excel usage and your added competence will give you more confidence within your organization.
How Can I Learn Advanced Excel Faster?
If you find this route of self-learning difficult or too long, it may be better to develop and learn advanced excel skills in a more systematic and methodical manner.
I would recommend going for a formal training on Microsoft Excel. Based on your level, and interest, you can choose an Advanced Excel Training in your city or suburb. This is the best way to learn advanced Excel.
Most Advanced Excel courses are 2-3 days long, depending on their coverage.
Make sure you join a workshop where lots of exercises and hands-on is provided, and not just a demo of Excel functionality.
It’s because we all learn better by doing it ourselves, rather than just watching someone else do it.
Plus, doing the exercises yourself will expose you to the common pitfalls and mistakes, which can then be rectified with the trainer/facilitator, and with worked examples and samples, you will gain a better understanding of the topics.
Since 2003, Intellisoft Systems has been providing short courses on Excel at all levels:-
We also have Excel training for creating management charts and reports – called the Excel Dashboard MasterClass. For those looking to automate Excel, you may choose to enroll in the 3 Day Practical, hands-on, VBA Macro Programming workshop.
What is Advanced Excel Training?
A short Excel training of 2-3 days will cover the key concepts. In such a formal Excel training program, the notes, handouts, exercises & sample examples are readily available for you to begin using immediately.
I personally find learning anything in a short course to be more beneficial. It covers the concepts quickly, and then I can focus on the details based on my interest areas.
Plus the best thing for a formal training is that we have a trainer or facilitator available to ask questions along the way.
Learning in a sheltered environment is better as newbies often stop when they stumble upon initial concepts and often give up completely.
What are the Topics in Advanced Excel Training?
Make sure your chosen Excel training at least covers the most important topics, at the very least. Our 3 day Advanced Excel course in Singapore covers all these, and much more, with practical examples and exercises.
If you are looking for the Best Excel training, look at some key things to consider, like time, speed, convenience & availability. If you can attend classroom training, I’d absolutely recommend it.
At Intellisoft, we provide both Classroom and e-learning via Zoom classes for Advanced Excel. You can choose from several dates available. These are extremely popular, and we have over 20+ years of running Excel classes.
All of our trainers come with years of industry experience. They have a passion for training and sharing their tips and tricks of Excel with you. You’d absolutely love our best advanced excel training course.
How Do I Get Excel Certified?
Most Advanced Excel courses will come with a certificate of Attendance. This is sufficient for most people, for real competence in Excel is more important that a certificate. Intellisoft offers such certificate of attendance for all of its 2 day Excel courses & workshops in Singapore.
To boost your resume & build your LinkedIn profile, a well recognized official certification in Excel is required!
There are 2 major certifications you can choose from
Microsoft Certified Professional (MCP) in several Microsoft technologies. For Excel, you can go for the Microsoft Office Specialist (MOS) certification. There are 2 levels – Associate and an Expert level. Better to go for the MOS Excel Associate level first, which is an easier Excel Exam. Then opt for the Expert MOS certificate in Excel. Beware that Microsoft certifications are pretty expensive.
Another option is to go for the extremely popular certification from the International Computer Driving License (ICDL Foundation). In Asia, this certificate is available at the Foundation and Advanced levels.
At Intellisoft Training, we are the official partners with Microsoft, and ICDL Asia, and are authorized to administer both the certifications in Excel. You can choose the Microsoft one, or the ICDL one, based on your preference.
The ICDL Certification is widely recognized by the Singapore government ministries. It is a tad cheaper in terms of the exam assessment fee too.
Plus, the Singapore government subsidizes the Advanced Excel Training Fee & Certification fee, allowing permanent residents and Singapore citizens to get certified in Advanced Excel skills. It is considered an Essential skill for office use, and is considered a must have for all office executives, analysts & managers. Do contact us for more information on this.
Next Steps: For Enhancing Your Spreadsheet Skills With Advanced Excel Training
With so much demand for Advanced Excel skills, so rich & useful functionality in Excel, and an easy path to victory with Excel, what are you waiting for. Grab the next chance to explore Excel in greater depths. Enroll in a classroom training, an e-learning training, or attend a Zoom class. Whatever it takes, just get started, right away.
Excel is the secret Swiss Army knife in your data analysis toolbox.
Just imagine, how far you can go with a proper, formal Advanced Excel Training! The opportunities are limitless, and so is your future!
Agentic Artificial intelligence applications are evolving rapidly, and so are the tools we use to build and manage them. Whether you are a business owner, developer, or data professional, you now have access to no-code and low-code platforms that make it easier than ever to design, integrate, and deploy AI solutions.
Three popular tools in for Agentic AI are n8n, LangFlow, and Flowise AI. While they may appear similar at first glance, they serve different purposes. Choosing the right one depends on whether you want AI workflow automation, RAG pipeline prototyping, or chatbot deployment.
n8n is an open-source workflow automation tool often compared to Zapier or Make. It connects hundreds of services like Google Drive, Slack, and CRMs, while also offering built-in support for AI integrations such as OpenAI, Pinecone, and LangChain.
⚠️ Weaknesses: Not ideal for deep experimentation with large language models (LLMs).
✅ Best for:AI workflow automation and connecting AI apps to your existing business processes.
Example: Automatically watch a Google Drive folder → extract text → embed into Pinecone → trigger OpenAI to summarize → send results to Slack or email.
What is LangFlow?
LangFlow is a visual drag-and-drop builder for LLM pipelines. It provides an intuitive interface to design RAG (Retrieval-Augmented Generation) applications, agents, and custom prompts. It is perfect for AI engineers and data scientists who want to prototype and tune LLM chains quickly.
🔑 Strengths: Easy experimentation, fine control over prompts, embeddings, retrievers, and memory.
⚠️ Weaknesses: Limited app integrations; not built for enterprise-scale automation.
✅ Best for:RAG pipeline prototyping, testing chunking strategies, and refining AI prompts.
Example: Load a PDF → split into chunks → generate embeddings → connect to Pinecone → rerank results → design prompt templates → test chatbot responses.
What is Flowise AI?
Flowise AI is a LangChain wrapper with a user-friendly UI. Like LangFlow, it lets you visually design LLM chains, but its main advantage is quick deployment. You can easily expose your chatbot or RAG pipeline as an API or an embeddable chat widget for your website or application.
🔑 Strengths: Fast deployment, LangChain compatibility, embeddable chatbot interface.
⚠️ Weaknesses: Less polished than LangFlow for experimentation, narrower integrations than n8n.
✅ Best for:Chatbot deployment and exposing LangChain-based apps as endpoints or widgets.
Example: Build a knowledge-base chatbot → embed it on your website → connect to Pinecone → answer customer queries using your documents.
Side-by-Side Comparison of n8n, LangFlow, and Flowise AI
Feature
n8n
LangFlow
Flowise AI
Primary Use
Workflow automation & ops
Visual RAG/LLM prototyping
LangChain chatbot/RAG builder
Integrations
300+ apps/APIs
Mostly AI/LLM tools
LangChain connectors
UI Style
Automation-first (Zapier-like)
Sandbox/experiment (Node-RED style)
LangChain visual interface
Best At
Orchestration, scheduling
Experimentation, prototyping
Quick chatbot deployment
Weak At
Prompt tuning, RAG iteration
External app integrations
Workflow automation
Deploy As
Cron jobs, webhooks, APIs
API (with more dev ops)
API or embeddable chatbot
User Type
Ops teams, DevOps, semi-tech
AI engineers, data scientists
Developers, AI builders
How to Choose Between n8n, LangFlow, and Flowise AI
Choose n8n if you need AI workflow automation and enterprise integrations.
Choose LangFlow if your priority is experimenting and fine-tuning RAG pipelines.
Choose Flowise AI if you want to deploy a chatbot or RAG app quickly with minimal coding.
In practice, many teams use all three:
Prototype in LangFlow,
Deploy with Flowise AI,
Orchestrate and integrate with n8n.
Conclusion
While n8n, LangFlow, and Flowise AI overlap in some areas, each has its own niche. n8n is the king of automation and integration, LangFlow excels at AI design and prototyping, and Flowise AI makes chatbot deployment fast and simple.
Instead of thinking of them as competitors, view them as complementary tools. By combining their strengths, you can build scalable, production-ready AI workflows that are both powerful and practical.
Learn Agentic AI Chatbot Development Without any Coding in Singapore
If you want to learn about AI, join our Agentic AI courses in Singapore with WSQ Funding. You can use SkillsFuture if you are eligible.
This is a full 2 day course, practical, hands-on, and emerge with atleast 3-4 AI chatbots ready by the end of the workshop. Contact us for Agentic AI courses today!
Your Small Business Just Got a Brain: Unlocking Potential with Agentic AI
I. Introduction: Meet Your New AI Teammate
Imagine an employee who never sleeps, learns on the job, anticipates problems, and handles complex tasks without you having to constantly look over their shoulder. Sound like a dream? Or perhaps, a harbinger of things to come? Welcome to the world of Agentic AI!
But what is this “Agentic AI” everyone’s talking about? It’s not just a fancy chatbot or another flavor of automation tool. Agentic AI is a smart, goal-oriented system that makes decisions, plans actions, and learns from its environment—all on its own, with minimal human babysitting.
Think of it as a proactive, autonomous digital worker, capable of navigating the complexities of the modern business landscape with a surprising degree of independence. It’s about shifting from reactive problem-solving to proactive solution implementation, a paradigm shift with potentially transformative implications.
Why should small businesses, in particular, care about this? Because it has the potential to level the playing field, allowing them to do “more with less,” boosting efficiency, and freeing up valuable time for strategic thinking and the big picture. It’s a chance to compete, not just survive, in an increasingly competitive world.
A Whistle-Stop Tour: Agentic AI Through the Ages
The pursuit of artificial intelligence is hardly new. The seeds of what we now call Agentic AI were sown decades ago, germinating slowly, sometimes painfully, but always persistently.
The Seeds of Intelligence (Mid-20th Century): It all started with fundamental questions. From Alan Turing’s simple yet profound inquiry, “Can machines think?”, to early chatbots like ELIZA, which, despite their simplicity, sparked the imagination and hinted at the possibilities of human-computer interaction, the idea of intelligent machines has been brewing for decades.
Rules & Rote (1970s-1980s): The next iteration involved expert systems, which followed strict rules, like a highly specialized, very literal assistant. A step forward, certainly, but still lacking the flexibility and adaptability we associate with genuine “thinking.”
Learning & Beating Chess Masters (1990s-2000s): Then came the era of Machine Learning! AI started learning from data, identifying patterns, and making predictions with increasing accuracy. IBM’s Deep Blue beating Kasparov wasn’t just a symbolic victory; it showed a glimpse of strategic autonomy, a machine capable of outthinking a human grandmaster.
Talking & Driving (2000s-2010s): The rise of Siri, Alexa, and self-driving cars brought AI into our daily lives, showcasing reactive, but increasingly capable, systems. These technologies demonstrated the potential for AI to understand and respond to our needs in real-time, albeit within predefined parameters.
The LLM Revolution (2020s-Today): And now, we arrive at the Large Language Model (LLM) revolution. Models like GPT have supercharged AI’s ability to reason, plan, and generate human-quality text. Agentic AI leverages these powerful LLMs as its “brain,” enabling it to act autonomously across a wide range of complex tasks.
We’re moving from simply asking “tell me what to do” to empowering the AI to “figure it out and do it.” This is a crucial inflection point, one that holds the potential to reshape how we work and live.
Your AI Co-Pilot: Practical Use Cases for SMBs Today
The potential applications of Agentic AI are vast and varied, spanning virtually every aspect of business operations. It’s not just about automating mundane tasks; it’s about creating intelligent systems that can augment human capabilities and drive innovation.
Customer Service Supercharger
Imagine a customer service system that provides 24/7 autonomous support, with “chatbots” that actually resolve issues, understand customer frustration, and even process returns without human intervention.
Even more impressively, picture Agentic AI proactively noticing a delayed delivery and automatically offering a discount to appease the customer, preempting a potential complaint and fostering customer loyalty.
Sales & Marketing Magician
Agentic AI can act as a tireless sales and marketing assistant, capturing inquiries, scoring leads, sending personalized follow-up emails, and even booking demos, all without human intervention.
Furthermore, it can design, launch, and optimize ad campaigns across various channels, adapting its strategies based on real-time performance data, ensuring maximum ROI.
Financial Wizardry
Agentic AI can automate bookkeeping and expense tracking, keeping your financial records tidy, flagging anomalies, and processing invoices with speed and accuracy. It can also detect fraudulent transactions and offer cost-saving suggestions, providing real-time insights to protect your bottom line and identify opportunities for greater efficiency.
Operations & Supply Chain Sensei
Agentic AI can optimize your inventory management by alerting you when stock is low, predicting demand spikes (especially crucial during the holiday rush!), and automatically reordering products as needed. It can also dynamically reroute shipments around unexpected traffic or weather conditions, ensuring timely delivery and minimizing disruptions to your supply chain.
HR Helper
From recruitment and onboarding to employee support, Agentic AI can streamline HR processes, filtering applicants, scheduling interviews, and guiding new hires through paperwork. It can also answer employee benefits questions and manage vacation requests, freeing up HR staff to focus on more strategic initiatives.
The Big Picture:
The real power of Agentic AI lies in its ability to automate entire processes, not just single tasks.
By orchestrating multiple AI agents working in concert, businesses can achieve unprecedented levels of efficiency and agility, allowing their human teams to focus on strategic, creative work that requires uniquely human skills and insights.
IV. The Hype, The Hope, and The Headaches: Opinions & Controversies
While the potential of Agentic AI is undeniable, it’s important to acknowledge the challenges and controversies that surround its adoption. A healthy dose of skepticism, coupled with a willingness to experiment, is crucial for navigating this rapidly evolving landscape.
Small Business Owners: Excited, But Wary: The sentiment among small business owners is largely positive, with many expressing excitement about the potential of Agentic AI to be a “game-changer” and enable them to “do more with less.” However, concerns persist regarding the cost of implementation, the lack of in-house AI expertise, the quality of available data, and a general fear of the unknown.
The question on many minds is: “Is it really worth the investment?”
Industry Experts: The Next Frontier, With a Caveat: Industry experts largely agree that Agentic AI represents the “next evolution” in artificial intelligence, with the potential to transform entire business processes, not just individual tasks. Massive market growth is predicted in the coming years, as more and more businesses begin to adopt this technology. However, experts also caution against unrealistic expectations and warn of a potential “AI backlash” if Agentic AI fails to deliver on its promises. They emphasize that good data is critical for success (“garbage in, amplified garbage out”) and that human oversight remains essential for defining goals and validating outputs.
Controversies & Ethical Minefields: The ethical implications of Agentic AI are complex and far-reaching, raising a number of important questions that must be addressed proactively. The “black box” problem, where the decision-making processes of AI agents are opaque and difficult to understand, can erode trust and complicate accountability.
The question of who is responsible when an autonomous agent makes an error remains unresolved. Concerns about privacy and data protection are paramount, given the vast amounts of data that AI systems require to function effectively. The potential for bias amplification, where AI systems perpetuate and amplify existing biases in the training data, is a serious concern, particularly in areas such as hiring and lending.
And, of course, there are ongoing debates about the potential impact of AI on employment, with some fearing widespread job displacement, while others argue that AI will create new, more strategic roles for humans. The fear of “rogue AI” is perhaps overblown, but the real concern lies in the potential for misaligned objectives, where AI agents pursue their goals too aggressively or in unintended ways.
Implementation Hurdles (Beyond the Ethical):
Beyond the ethical considerations, there are a number of practical challenges that businesses must overcome in order to successfully implement Agentic AI. The technical jargon can be daunting, and designing complex logic, ensuring reliability, and debugging autonomous systems requires specialized expertise.
Integrating new AI agents with existing legacy systems can be a major headache. And finally, these systems can be power-hungry and expensive to scale, requiring significant investments in infrastructure and resources.
V. Beyond Today: The Future of Your Autonomous Digital Workforce
The future of Agentic AI is bright, with rapid advancements on the horizon that promise to transform the way we work and live.
Smarter, Faster, More Independent: In the years to come, we can expect to see AI agents that are truly autonomous, capable of making decisions and initiating actions with minimal human intervention. These agents will possess deep reasoning capabilities, enabling them to understand nuance, plan multi-step projects, and offer incredibly accurate insights. Furthermore, they will be multi-modal marvels, seamlessly processing and responding to voice, text, images, and video.
Proactive & Predictive Power: Agentic AI will move beyond reactive problem-solving, anticipating and resolving issues before they even arise. It will be able to predict customer churn, market shifts, and optimize everything from pricing to staffing, giving businesses a significant competitive advantage.
The Rise of the Digital Team (Multi-Agent Systems): We will see the rise of sophisticated multi-agent systems, where specialized AI agents collaborate with each other to tackle huge, complex tasks. Imagine a mini digital business department, all working together seamlessly, integrated into your existing CRM, ERP, and other business platforms.
Self-Healing AI: AI systems will become increasingly self-healing, able to detect and fix their own errors, dramatically reducing downtime and improving reliability.
The Human-AI Partnership Evolves: The relationship between humans and AI will continue to evolve, with a greater focus on ethical AI design, transparent systems, and robust governance frameworks. Humans will shift from being “doers” to “designers, managers, and strategists” for their AI teams, leveraging their uniquely human skills to guide and augment the capabilities of their AI counterparts.
Market Growth Explosion: Billions of dollars are being poured into this space, signaling rapid innovation and increasing accessibility for businesses of all sizes.
VI. Conclusion: Embrace the Autonomous Advantage
Agentic AI is not a futuristic fantasy; it’s a present-day reality with the potential to revolutionize the way small businesses operate. It offers unprecedented opportunities to boost efficiency, enhance customer experiences, and unlock new avenues for growth.
So, what’s your next step? Don’t get left behind! Start small, identify specific problems that Agentic AI can solve, prioritize data quality, and embrace the learning curve.
Remember, the future isn’t about AI replacing humans, but about empowering humans with incredible AI partners. Are you ready to lead your digital workforce into the future? The autonomous advantage awaits.
Learn Lookup Functions in Excel at Intellisoft Singapore
For the power users of Excel, the mastery of INDEX, MATCH & OFFSET can be considered vital, as these are considered the advanced lookup functions in Excel.
But with the introduction of XLOOKUP, some of the jugglery created by mixing INDEX & MATCH combination is no longer required.
If you are new to Excel, or don’t have a lot of experience with the basics of Excel, join our most popular Basic Excel Course Singapore. It is 2 full days classroom training.
VLOOKUP Function of Excel
The most MUST HAVE Function ever. Even Excel gurus can’t live without it. I polled a group of Excel experts recently, asking if Excel’s VLOOKUP was overrated. I got a severe backlash for even mentioning it.
Almost everyone said that it is their GO TO function, an absolute must-have and that Excel won’t be that useable if this VLOOKUP function was taken away from Excel!
Most people swear by their VLOOKUP functions. It is their GO TO function when they want to lookup value of any type.
According to legend, VLOOKUP mastery is what separates the Pro Excel users from the Amateurs!
Vlookup is akin to using a dictionary. You know the word, and you want to find out the meaning. This dictionary is the range of cells that contain the lookup up value, and its associated value. The V in VLOOKUP stands for the dictionary being a vertical dictionary. So for a vertical lookup, you must use VLOOKUP function only.
=VLOOKUP(word, dictionary, column number of meaning, exact_match_ype)
The first column in the dictionary must contain the lookup up value, and the first row should be of the data. You should not include the headings in the dictionary table. The difficulty most people have with VLOOKUP is the last flag – the logical value of TRUE or FALSE(You can use 1 for True and 0 to indicate the False flag).
Once a matching value is found out, you will be able to get the return value based on the search. The error value of N/A will be generated if there is no exact match until the last row.
The mystery is created because to use VLOOKUP for an exact match, you have to specify the last optional flag, and set its value to a FALSE or a 0. By default, it is set to 1, which is useful for an approximate match type only. So for an exact match of a specific value, the last parameter is not really optional… it is mandatory.
VLOOKUP EXAMPLE:
There are a couple of major shortcomings in using VLookup function of Excel. First of all, the VLOOKUP is really a slow function. It is apparent when you do a lookup on a large list of 100,000 values or more. Secondly, VLOOKUP can only look up up a corresponding value from the columns on the right of the looked-up value. It can’t look to the left!
Make sure you master this Excel function really well.
HLOOKUP Function in Excel
An oft-forgotten cousin of VLOOKUP, this Horizontal Lookup and Reference function in Excel works in a similar way too. The only difference is that in this case, a lookup dictionary is a horizontal dictionary of columns, denoted by the H.
HLOOKUP is most used in range lookups, rather than exact matches, as columns are not the best suited for exact values, because of their limit of 16,000. Where a list can grow vertically to over a million records easily.
In the following formula, this lookup function searches for the closest match, especially when we are not searching for an exact match, but an approximate match. The dictionary is the table array and it is recommended that we use the absolute reference to lock the cells from moving.
=HLOOKUP(A5, $G$2:$K$100, 2)
Here the HLOOKUP will search for the exact or the next smallest value in the lookup table absolute range of $G$2 to $K$100, and return the second row. If you want the third row, you can change the 2 into a 3.
Both VLOOKUP & HLOOKUP return values from a single row or a single column.
Using the XLOOKUP Function in Excel
Did you know that new functions are added to Excel till today, and these are extremely useful functions making approximate matches as well as exact matches.
Finally, after years of backlash at Microsoft for creating the mess with the Match Type (True and False) in VLOOKUP, they got rid of it completely in the Excel XLOOKUP function.
And by default, XLOOKUP is set to do an exact match.
XLOOKUP requires a deeper understanding of the various scenarios. I’d recommend attending our formal ADvanced Excel Training to build a strong foundation in Excel. You can call us at 6250-3575 for more information of our courses and available enrollment dates for classroom training in Singapore.
This new XLOOKUP function of Excel is only available from Microsoft Office 365 users. It does not work on Excel 2016 or Excel 2019 versions.
Using INDEX Function in Excel
If you know the row number, you can find the value on that row or column cell directly.
INDEX can be used as an Array function also. Paired with MATCH, you can find any value on any row or column in a 2-dimensional array.
Index can help you to find the value on the row or the column of the specified number
How To Use Excel MATCH Function
When you want to find an exact match in an array and return the row number in the array, MATCH comes to your rescue. It is one up on VLOOKUP, which requires you to know the column you want to return. MATCH can find a match for a value that is lower, exactly equal or higher than the specified value.
Paired with INDEX, an INDEX & MATCH Function can manage to look up on the left or the right of any array of cells.
Master the OFFSET Function within Excel
To navigate your way in a two-dimensional array of rows and columns, you can use the OFFSET function in Excel. It can traverse any number of Rows or Columns, and get you the value.
How to use the offset function in Excel:
=OFFSET(Starting Cell, Row to move up or down, Columns to move left or right, Number of rows required to be returned, number of columns required to be returned)
I generally use OFFSET more than INDEX and MATCH combinations. Using one super-powerful OFFSET function is more straightforward.
Once you start using Offset in Excel, you wouldn’t want to use other lookup functions of Excel.
When Do I Use the INDIRECT Function of Excel?
The Excel INDIRECT function returns the reference specified by a text string. References are immediately evaluated to display their contents.
Use the INDIRECT function when you want to change the reference to a cell within a formula, without changing the formula itself.
=INDIRECT(A3)
The above Indirect function will check what is in cell A3. And A3 will have the cell reference to another cell. So if A3 contains B35, Excel will then read the value in cell B35.
Thus, we can get the value of the reference in cell A3. The reference is to cell B3, which may contain the value 45.
Will return a 4. This is because there are 4 Rows in the given range.
How to Use the COLS Function in Microsoft Excel?
Displays the column number of a reference cell.
=COLS(A1:B4)
Will return a 2. This is because there are 2 Columns in the given range: A & B
Using the TRANSPOSE Function of Excel like a Pro
Converts rows into columns and columns into rows. Just like the Transpose feature in Paste Special, but done programmatically.
So if you use TRANSPOSE(A1:D3), you have selected 4 columns and 3 rows.
After the Transpose is completed, you will get an array reference of 3 Columns, and 4 Rows. The horizontal table would have flipped and will be visible vertically.
Pretty nice use of hanging values in rows into columns.
When Do I Use the UNIQUE Function of Excel?
The UNIQUE function of Excel generates a list of unique values that automatically spill down. An array function can be used to create data validation lists too. Available from Microsoft Office 365 onwards. This UNIQUE function is not available in Excel 2016 or Excel 2019.
Learning the Lookup Functions in Excel Quickly & Easily
As you can see, there are a lot of LOOKUP functions in Excel, and learning and mastering them takes time. But once you do master them, you can do wonders with your Excel skills.
It is worth the effort to learn the Excel Lookup Functions. Call Intellisoft at 6250-3575 or What’s App at +65 9066 9991 for Excel 365 Training that covers the key Lookup functions of Excel.
You will definitely enjoy it!
Cheers,
Vinai
Founder & Master Trainer at Intellisoft Systems in Singapore.
Learn from expert tips, tricks and resources for Excel, PowerPoint, Photoshop, Python, Power BI, Project Management, IT, Soft Skills & more with our Email Newsletter. Plus get the latest news on Grants. Join Today!