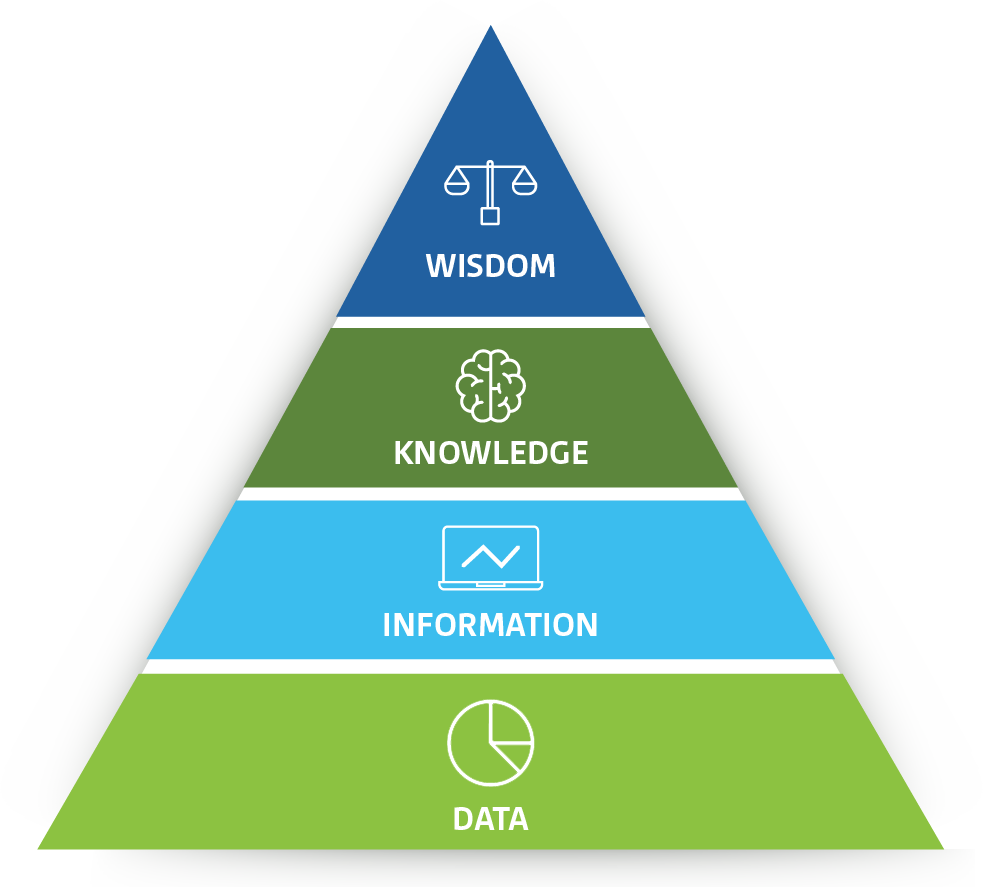
 Data is at the heart of business intelligence and analytics.
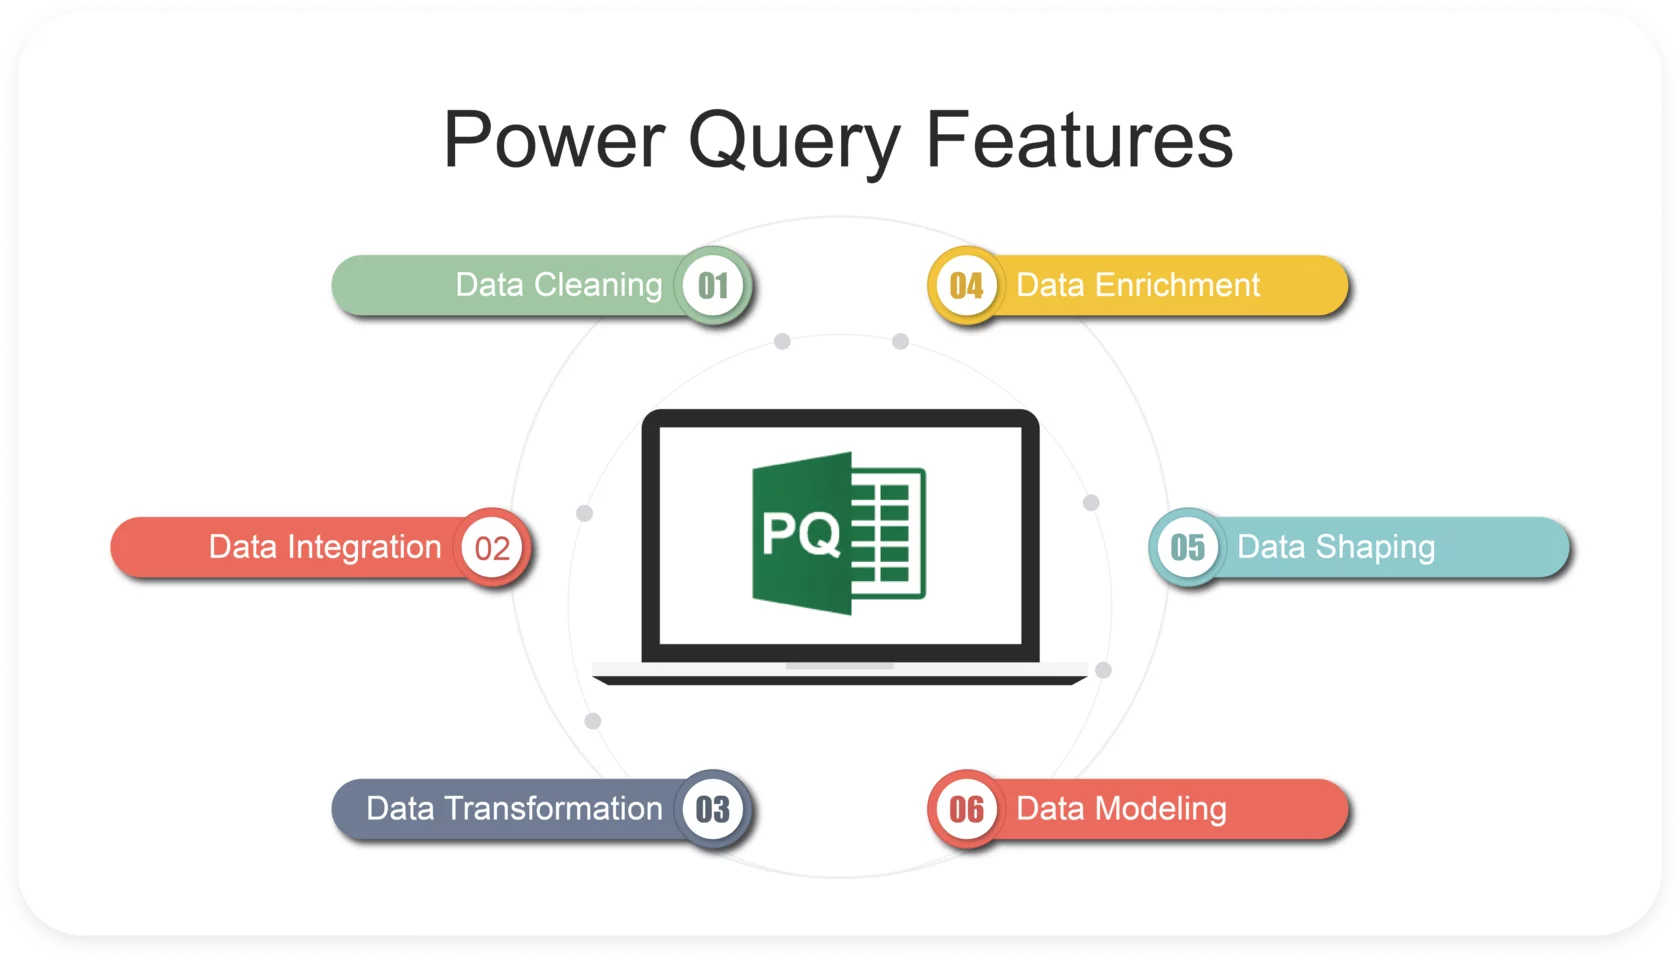
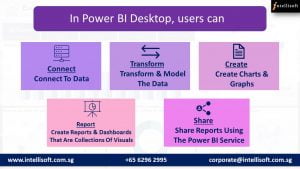
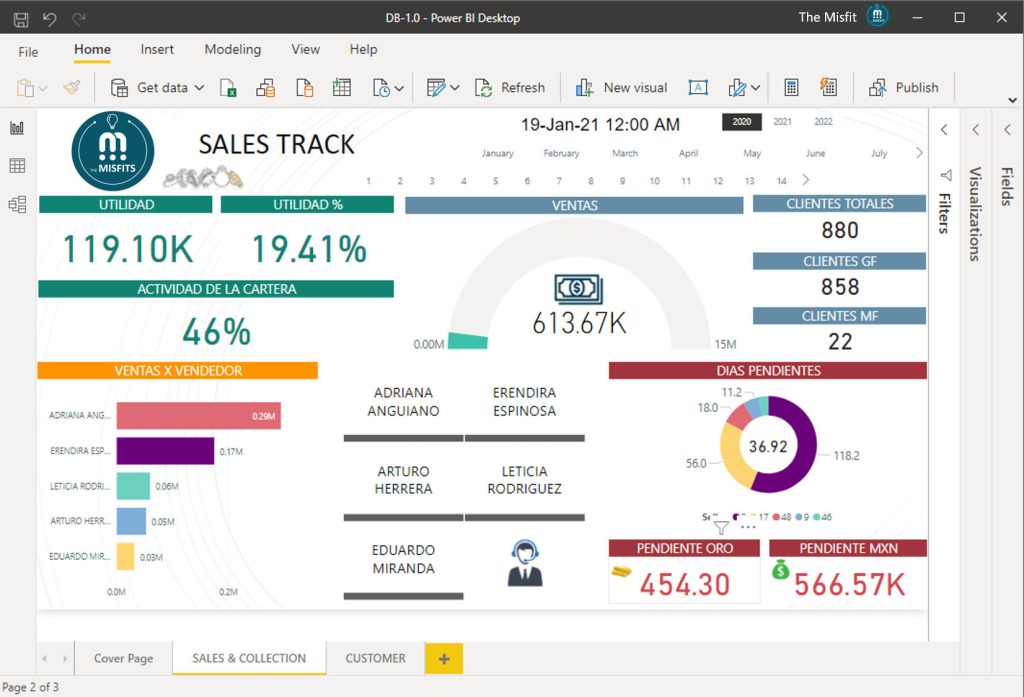
Microsoft Power BI is a powerful tool that empowers users to transform raw data into valuable insights.
At the core of business intelligence lies the creation of a robust data model.
In this article, we will explore the essential aspects of data model creation in Power BI and the considerations that should be kept in mind as you build, and use your data model for data analysis and visualization.
Understanding Data Models
A data model in Power BI is a structured representation of data that enables efficient analysis and visualization.
It serves as the foundation for all your reports and dashboards, ensuring that the data is organized and easy to work with.
Without a well-designed data model, you may find it challenging to derive meaningful insights from your data.
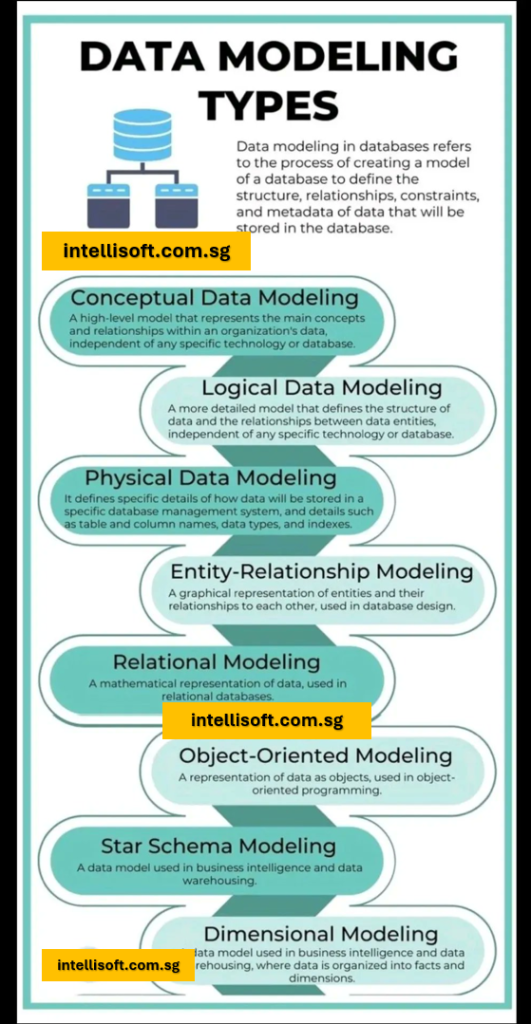
In Power BI, we can create a data model based on
- Star Schema Modeling Techniques
- Dimensional Data Modeling
- Snowflake Data Modeling
Types of Tables in Data Models
Types of Tables in Power BI – Fact & Dimension Tables & Their Properties
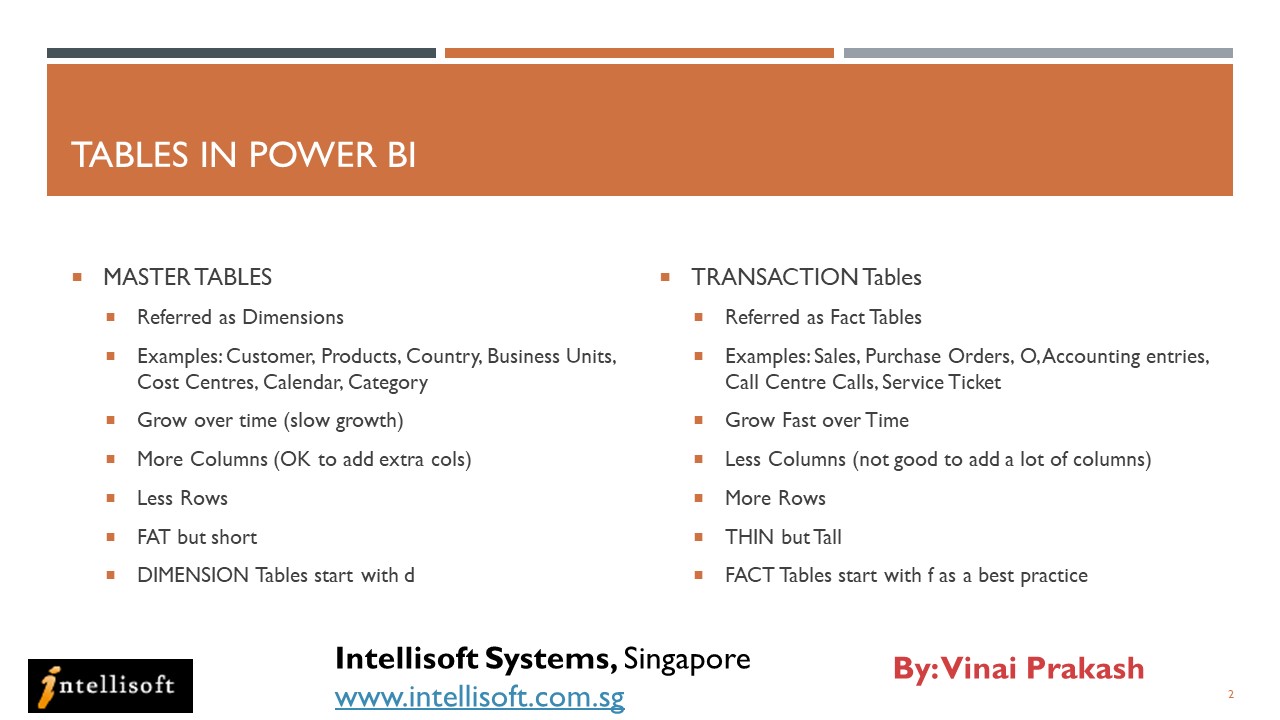
1. MASTER Tables
MASTER tables are the foundational building blocks of your data model. They are characterized by their slow growth over time, making them ideal for storing reference data such as Customer, Products, Country, Business Units, Cost Centers, Calendars and Categories.
Key features of MASTER tables include:
- Slow Growth: MASTER tables typically evolve slowly over time, with additions of new data occurring infrequently.
- Flexibility: You can easily add extra columns to MASTER tables to accommodate new attributes or information. The more columns, the more ways you can “slice and dice” the data!
- Fewer Rows: These tables tend to have fewer rows, often referred to as “short” tables.
- “FAT” but Short: MASTER tables may have many columns, making them “FAT” in terms of width but short in terms of height (number of rows). Thus, we don’t hesitate to add new columns as needed, as “Calculated Columns” using DAX (Data Analysis EXpressions in Power BI)
- Naming Convention: To distinguish them from other table types, MASTER tables should be named with a prefix, like “d.”, which denotes that this table is a DIMENSION table.
2. TRANSACTION Tables
TRANSACTION tables are designed to capture data that changes rapidly and involves high transactional volumes.
Examples of TRANSACTION tables include Sales, Purchase Orders, Accounting Entries, Call Centre Calls, and Service Tickets.
Key features of TRANSACTION tables include:
- Rapid Growth: TRANSACTION tables grow quickly over time, recording numerous data entries.
- Limited Flexibility: Adding extra columns to TRANSACTION tables can be costly in terms of increasing table size and impacting query efficiency.
- More Rows: These tables contain a substantial number of rows, often referred to as “tall” tables.
- “THIN” but Tall: TRANSACTION tables typically have fewer columns, making them “THIN” in terms of width but tall in terms of height.
- Naming Convention: To distinguish them from other table types, TRANSACTION tables should be named with a prefix “f.“, to denote a FACT table.
Dimension and Fact Tables
In the context of data modeling in Power BI, Dimension and Fact tables play distinct roles. Dimension tables are typically associated with MASTER tables, serving as a reference for attributes you want to analyze. Fact tables, on the other hand, relate to TRANSACTION tables, capturing the core data you want to measure and analyze.
Determining Your Analysis Requirements
Before you dive into data model creation, it’s crucial to identify your analysis needs. Determine the specific data elements you want to analyze.
For example, if you aim to analyze sales by year, by country, by division, and by category, you should identify “sales” as your Fact table and “year,” “country,” “division,” and “category” as your Dimension tables.
Similarly, to analyze expenses by department by country by geography, and by year, quarter or month, the “Expenses” will be the Transactions (Fact Table), and the “geography”, “country”, “department”, “year”, “quarter”, “month” will be the dimensions to slice and dice the expenses.
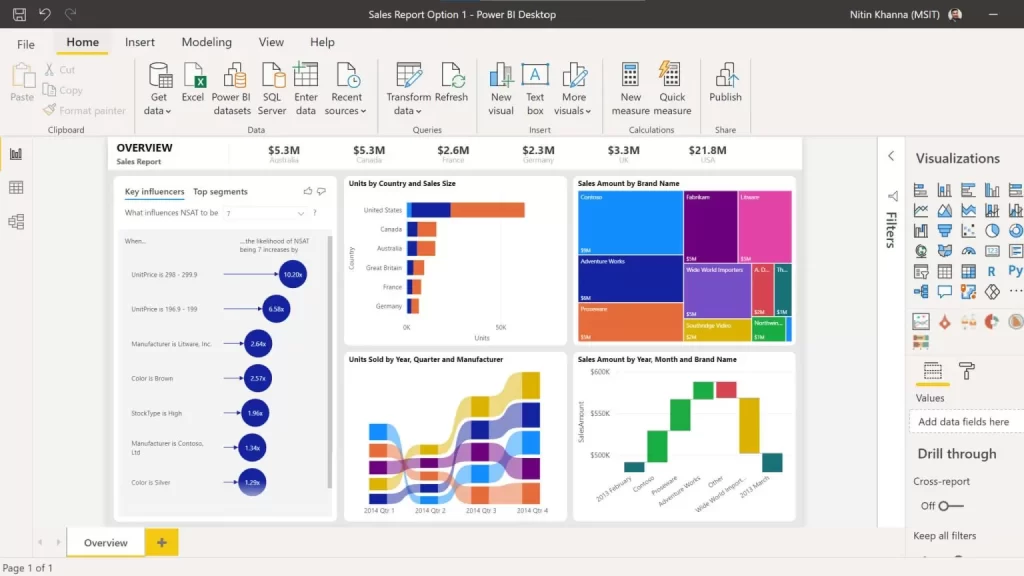
Building the Data Model in Power BI
Creating a data model in Power BI involves several key steps.
Start by importing data from various sources, such as databases, spreadsheets, or online services. There are hundreds of sources that can be loaded into Power BI. CSV, Text, PDF, multiple files from a single folder can all be loaded easily.
For how to load such data, join our Power BI Course in Singapore.
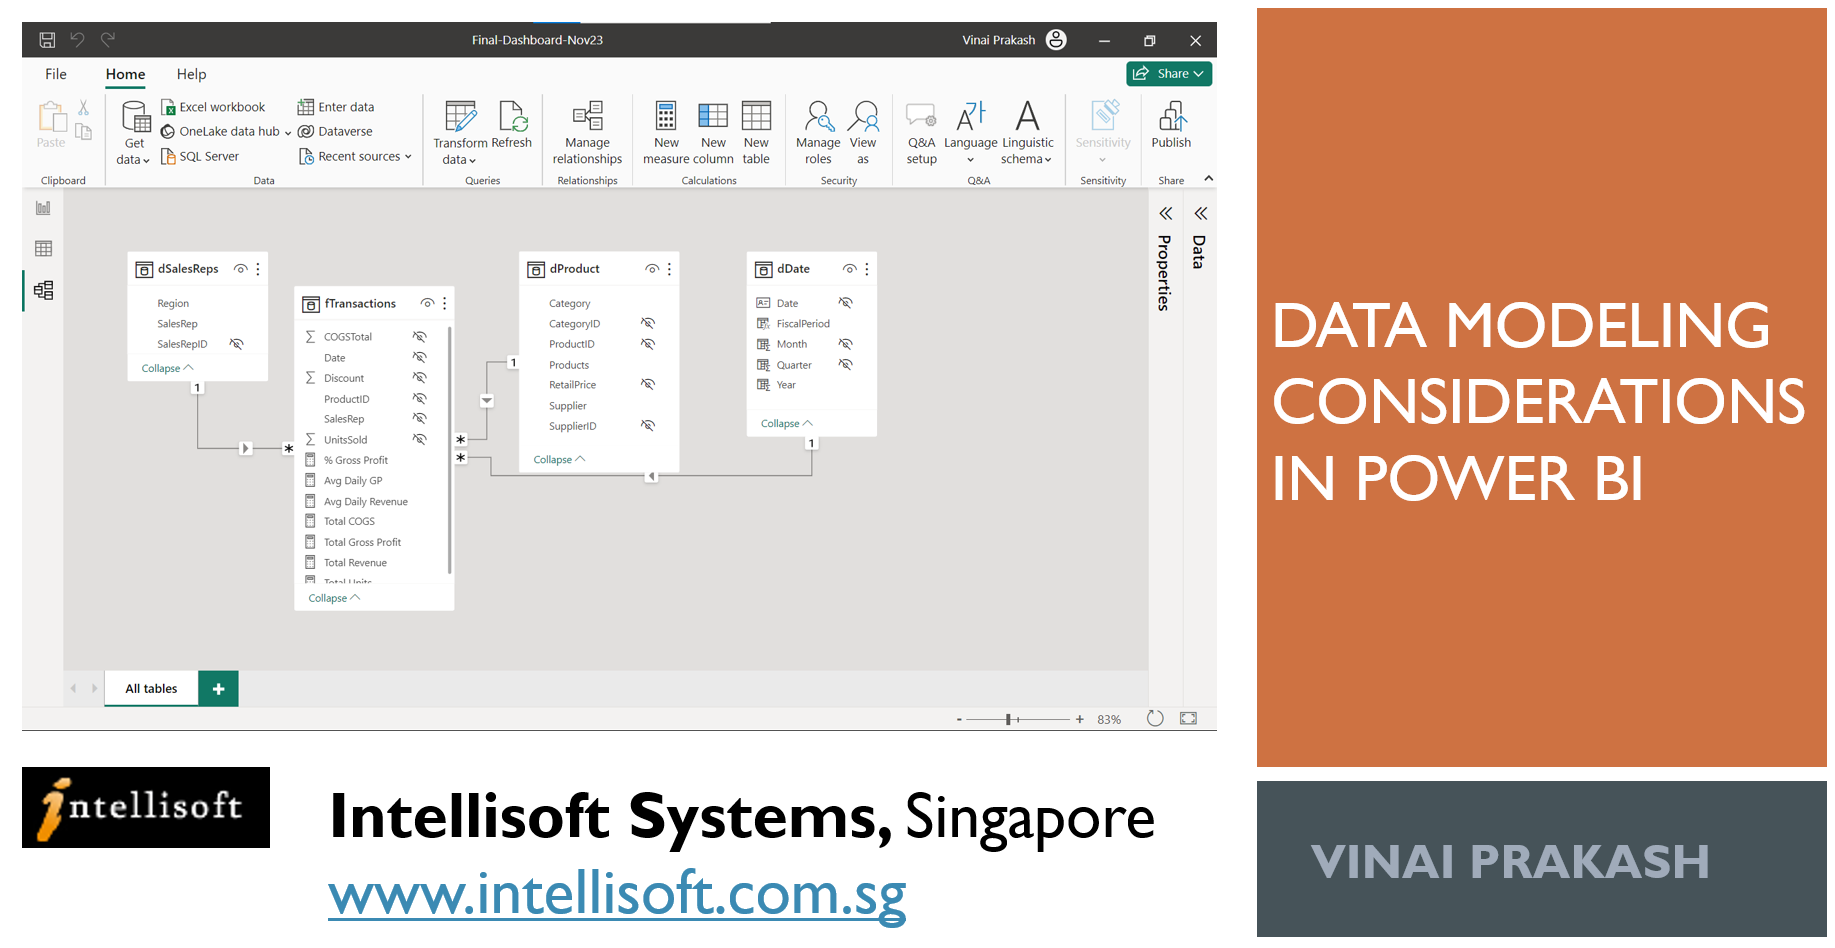
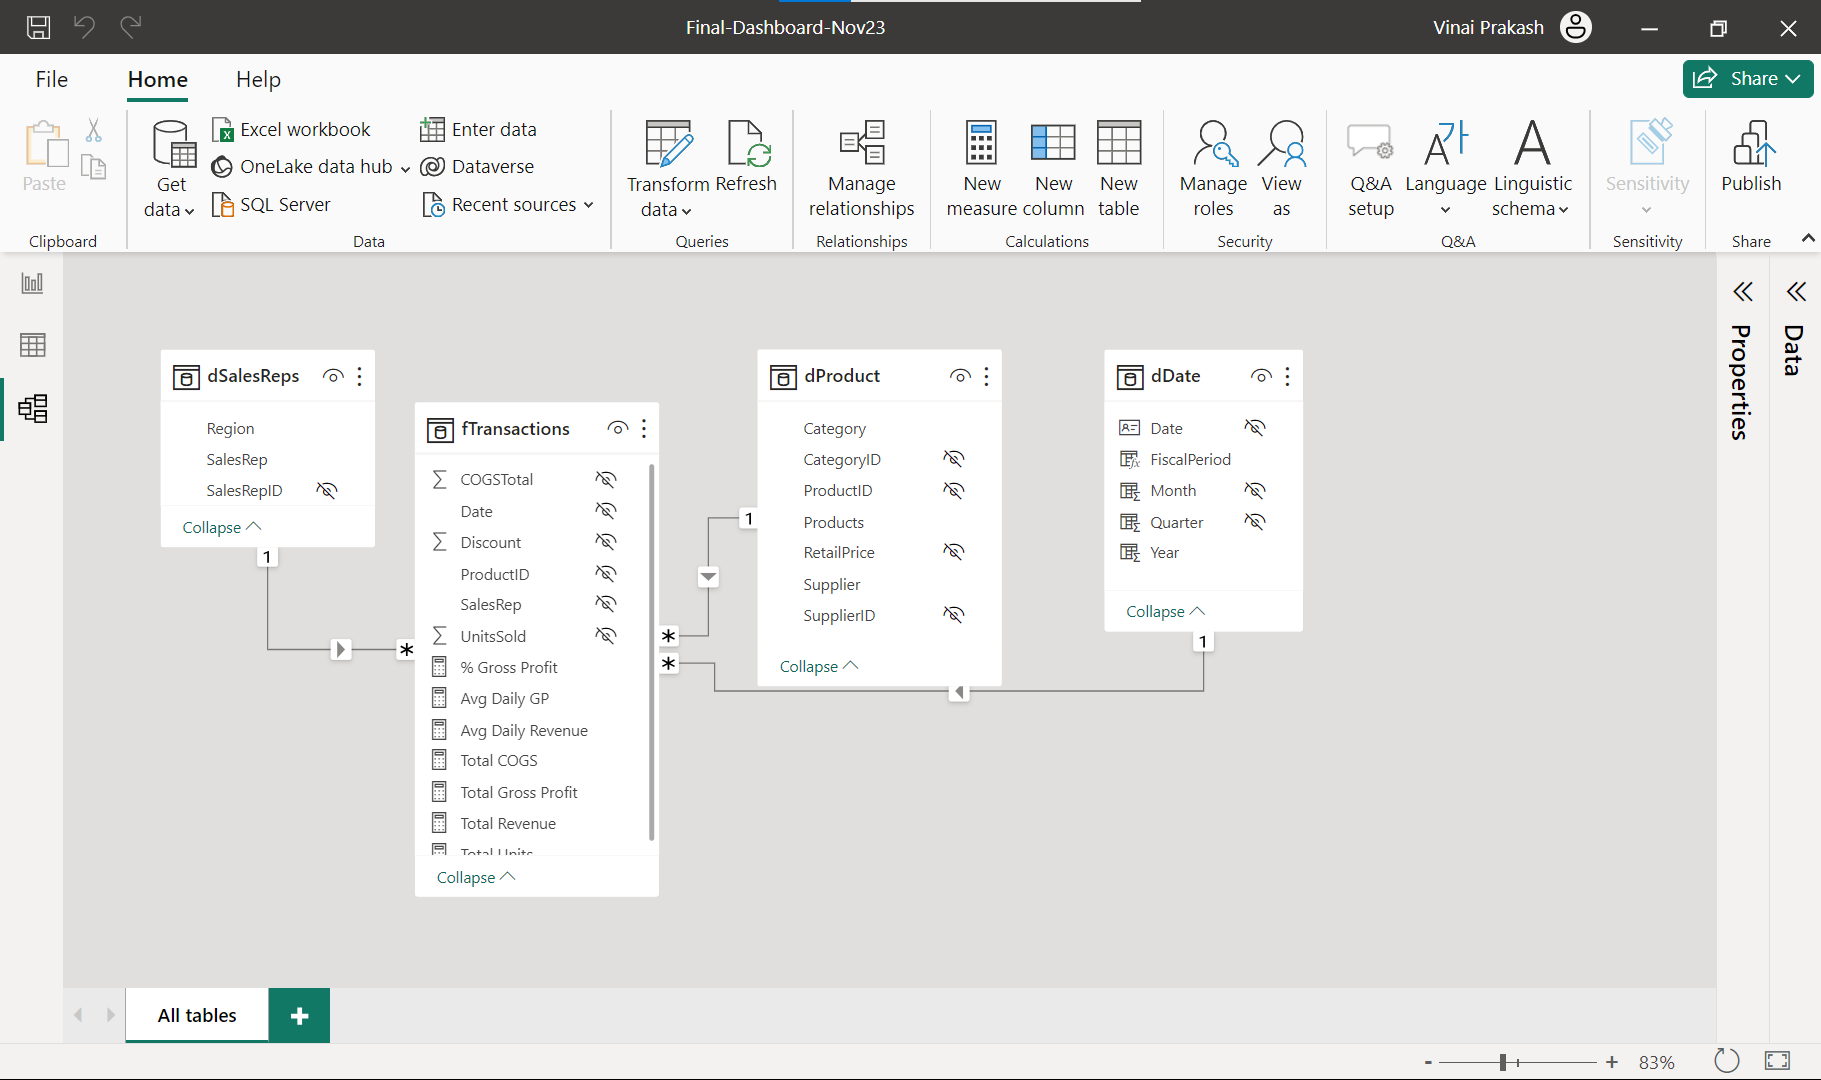
Next, define relationships between tables, specifying how they are connected in the Model View in Power BI.
Arrange the tables in a Star Schema fashion. Another way is to keep the master tables on the top, and the Transaction table at the bottom. This way, you can “look up” the values for any transaction from the Dimension tables above.
 Finally, structure your data to ensure it is ready for analysis.
Best Practices for Building the Data Model:
- Choose the Right Data Sources: Select data sources that are relevant to your analysis and ensure they are structured in a way that is conducive to modeling.
- Normalize Data: Normalize your data model to reduce redundancy. This means avoiding duplication of data and creating relationships between tables.
- Understand Data Types: Be aware of the data types used in your model to optimize performance and avoid compatibility issues.
- Define Hierarchies: Create hierarchies within Dimension tables to allow for more flexible and intuitive drilling down into data.
- Use Calculated Columns and Measures: Instead of adding unnecessary columns to Fact tables, leverage calculated columns in Dimensions, and measures in Fact tables to perform calculations as needed.
Relationship Management
Establishing and managing relationships between tables is crucial for successful data modeling. Power BI’s intuitive interface makes it easy to define these relationships, which help in connecting data from different tables to answer complex questions.
In Power BI, relationships between Fact and Dimension tables are essential for combining and analyzing data from multiple sources. These relationships come in different cardinality types:
- one-to-one (1:1),
- one-to-many (1:M), and
- many-to-many (M:M).
Let’s explore each of these relationship types:
- One-to-One (1:1) Relationship:
- In a one-to-one relationship, each row in one table corresponds to exactly one row in another table.
- This relationship is used when you have tables that share a common field, and the relationship between them is unique and direct.
- One-to-one relationships are not very common in Power BI but can be useful in specific scenarios, such as when you have a customer table and an address table, and each customer has only one unique address.
Example: A “Person” table with a unique “Employee ID” linked to an “Employee Details” table with one record per employee.
- One-to-Many (1:M) Relationship:
- In a one-to-many relationship, each row in one table can relate to multiple rows in another table, but each row in the second table is related to only one row in the first table.
- This relationship is the most common in Power BI, as it represents a parent-child relationship, where one table contains the unique values (parent) and another table contains related values (child).
- One-to-many relationships are used for scenarios where you have one primary table and related information in a secondary table.
Example: A “Customer” table with unique customer IDs related to a “Sales” table with multiple sales records for each customer.
- Many-to-Many (M:M) Relationship:
- In a many-to-many relationship, multiple rows in one table can relate to multiple rows in another table, and vice versa.
- Many-to-many relationships are less common and usually require an intermediate table to resolve them. This intermediate table is often referred to as a “bridge” or “junction” table.
- This relationship type is used when you have situations where multiple values in one table can be related to multiple values in another table, and you need to establish these connections.
Example: An “Orders” table related to a “Products” table through an “OrderDetails” bridge table, as each order can contain multiple products, and each product can be a part of multiple orders.
Another example is where an author can have many books authored, and each book can be authored by one or many authors.
Best Practices for Relationship Management:
Understand Cardinality: Cardinality defines the relationship between tables, including one-to-one, one-to-many, or many-to-many. Ensure that the cardinality matches your data structure.
Use Bi-Directional Filters Sparingly: Bi-directional filters can be useful, but they should be used with caution to avoid unintended consequences.
Create DAX Measures: Use Data Analysis Expressions (DAX) measures to create calculations that span multiple tables, enhancing the depth of your analysis.
DAX Measures are the new name for Formulas in Power BI. They calculate the value in the formula in-memory, without taking up any additional space in the data file. Thus, the data file stays small, and the in-memory calculations can be performed quite fast.
A Power BI file is like a Zip file, compressing the data at least 10 times or more in most cases. The extension of Power BI files is .pbix.
Data Model Considerations for Scalability
As your data volume grows, it’s essential to consider the scalability of your data model. Techniques such as data compression, partitioning, and aggregations can be employed to handle larger datasets while maintaining model performance.
Best Practices for Scalability:
- Data Compression: Implement data compression techniques to reduce the size of your model, which will lead to faster query performance.
- Partitioning: Use data partitioning to manage large datasets more efficiently, making it easier to work with historical or archived data.
- Aggregations: Create aggregations to pre-calculate summary data, allowing for quicker responses to user queries while dealing with vast datasets.
Conclusion:
In conclusion, data model creation is a fundamental step in Power BI that can significantly impact the quality of your data analysis and reporting.
By understanding the types of tables, defining your analysis requirements, and following best practices, you can build effective data models that lead to valuable insights and informed decision-making.
Mastering the art of data modeling is essential for anyone looking to harness the full potential of Power BI’s capabilities. With careful consideration of scalability, relationships, and best practices, you can ensure that your data model remains efficient and effective as your data and reporting needs grow.
To Learn more about Data Modeling in Power BI, join our Power BI MasterClass in Singapore here. It is conducted by our Founder & Master Trainer, Mr. Vinai Prakash.
Article Written by Vinai Prakash, MBA, PMP, GAP, ACTA Certified, EXCEL & Power BI Enthusiast!
Additional Resources for Power BI
Training Courses
Learn Microsoft Power BI Suite For Better Data Analysis & Reporting
Power BI Tips, Tricks & Video Tutorials
Power BI Tip #2: Reference Query Results in Another Query With Power Query [Video Tutorial]
Power BI Tip #6: Fixing The Vertical Axis in Power BI Visualisations