New Features in Microsoft Access

Microsoft Access Training in Singapore

If you’re searching for a more flexible data management system, a database might be just the salvation you’re looking for and Microsoft Access provides an excellent option. With Access you will experience new interface with different look and feel. It has got sleeker look and it has more colors to make it more modern style, which makes Access still relevant now and beyond.

You can not only save the document which you can access anywhere but at the same time you can collaborate it with other people.

Microsoft Access Logo

Features of  Microsoft Access

Access 2013 has changed the tabs of ribbons and made it capitalized which was not there before.

Also if you have not worked with SkyDrive before that’s something which is going to be new for you. Want to explore this?

So when you are trying to open any new or existing document you don’t only have a option of choosing it from Recent but also you can also select it from SkyDrive.

After entering your account details it enters into your SkyDrive and then you can browse your database the same way as you browse in windows explorer. Like downloading we can also upload our local database to the SkyDrive.

Access 2013 has moved towards the Cloud and can now produce Web Apps which can be accessed through a browser.

There’s a quantity of Wizard help available in constructing these, so you’re not working from the sketch up when constructing one. Navigation and different views are pre-constructed, as long as the Web App you’re after can be based on one of the database templates provided.

Here are the top features you should explore in Access .Microsoft Access Training in Singapore at Intellisoft

  • Using Templates in Access
  • Apps in Access
  • A Focus on the Web: Office 365, SharePoint, and Access
  • SQL Server: Behind the Scenes of Access

If you would like to learn more about these new features in Microsoft Access, or would like to attend the Microsoft Access Training, do contact us at Intellisoft Systems.

Check out if you are really Microsoft Office Proficient.

What are the Benefits of Learning Microsoft Access

Learning Microsoft Access offers a variety of benefits for individuals and professionals who work with databases, data management, and data analysis. Here are some key advantages of learning Microsoft Access:

1. Efficient Data Management: Microsoft Access enables you to organize and manage large amounts of data in a structured manner. You can create tables, relationships, and queries that help you maintain data integrity and prevent redundancy.

2. User-Friendly Interface: Access features an intuitive interface with a graphical design view that makes it accessible to users without extensive programming experience. This allows you to design and manage databases with ease.

3. Customized Data Entry Forms: You can design custom data entry forms in Access, tailored to your specific needs. This streamlines data entry processes and ensures consistent and accurate data input.

4. Structured Query Language (SQL) Integration: Access allows you to use SQL for more advanced querying and data manipulation. This skill is transferable to other relational database management systems (RDBMS) as well.

5. Querying and Reporting: Access offers powerful querying capabilities, allowing you to extract specific data subsets, perform calculations, and create meaningful reports based on your data.

6. Data Analysis and Insights: Learning Access empowers you to analyze data by creating complex queries, running aggregate functions, and generating summary reports, helping you derive valuable insights.

7. Data Validation and Integrity: Access enables you to implement data validation rules and constraints to ensure that your data is accurate, consistent, and conforms to specified criteria.

8. Data Security: Access provides options for securing your databases by setting permissions and user roles, allowing you to control who can view, edit, or manipulate your data.

9. Integration with Other Microsoft Office Apps: Access seamlessly integrates with other Microsoft Office applications, such as Excel and Word, allowing you to import and export data and generate reports in familiar formats.

10. Career Opportunities: Proficiency in Access is a valuable skill sought after by employers across various industries. It can open doors to positions related to data analysis, data management, and database administration.

11. Small Business Solutions: Access is often used by small businesses to create customized databases for inventory management, customer tracking, project management, and more.

12. Learning Transferable Skills: Learning Access equips you with fundamental database design and management skills that can be applied to other relational databases like MySQL, PostgreSQL, or Oracle.

Mastering Microsoft Access offers a range of benefits that can enhance your data management capabilities, improve efficiency, and provide you with valuable skills for various career paths.

Whether you’re working with data as part of your job or simply looking to gain new skills, mastering Microsoft Access can be a valuable investment of your time and effort.

Who Uses Microsoft Access These Days?

Microsoft Access is used by a wide range of individuals, professionals, and organizations for various purposes related to data management, reporting, and analysis. Here are some examples of who uses Microsoft Access:

1. Small Businesses and Startups: Small businesses and startups often use Microsoft Access to create custom databases for tasks such as inventory management, customer relationship management (CRM), order tracking, and project management.

2. Data Analysts and Researchers: Data analysts and researchers use Access to organize and analyze data for research projects, surveys, and data-driven decision-making. They can create queries, run calculations, and generate reports to extract insights from their data.

3. Administrative Professionals: Administrative staff use Access to manage information such as employee records, event schedules, contact lists, and resource allocation. Custom databases can help streamline administrative tasks.

4. Educators and Students: Access can be used in educational settings for teaching and learning database concepts. Students may learn how to create databases, design forms, and perform basic data analysis.

5. Nonprofit Organizations: Nonprofits use Access to track donations, manage volunteer information, and create reports for stakeholders. Custom databases help them efficiently manage their operations.

6. Project Managers: Project managers can use Access to create databases for tracking project progress, tasks, timelines, and resources. This aids in organizing and overseeing complex projects.

7. Marketing and Sales Professionals: Marketing and sales teams use Access to manage customer data, track sales leads, analyze marketing campaigns, and generate reports on sales performance.

8. Human Resources Departments: HR departments use Access to manage employee data, track performance reviews, monitor training programs, and generate reports for compliance and analysis.

9. Government Agencies: Government agencies utilize Access to manage various data, such as public records, permits, licenses, and citizen information. Custom databases help streamline operations.

10. Consultants and Freelancers: Independent consultants and freelancers might use Access to track client information, project details, expenses, and generate invoices.

11. Research Institutions: Research institutions and academic organizations use Access for managing data related to ongoing research projects, experiments, and academic studies.

12. Event Planners: Event planners use Access to manage event details, guest lists, RSVPs, and other logistical aspects of event planning.

13. Health and Medical Facilities: Medical practices and healthcare facilities can use Access to manage patient records, appointments, billing, and other administrative tasks.

14. Real Estate Agents: Real estate agents might use Access to track property listings, client preferences, transaction history, and generate property reports.

These are just a few examples of the diverse range of professionals and organizations that use Microsoft Access to manage, analyze, and report on their data.

Access provides a user-friendly interface for creating custom databases that cater to specific needs and tasks, making it a versatile tool for a variety of industries and roles.

Why Should You Join Intellisoft For Your Access Course Training?

Here are some compelling reasons why you should consider Intellisoft Systems’ Microsoft Access training courses as your top choice and why you should strongly consider joining these courses:

  1. Expertise and Experience: Intellisoft Systems has a proven track record of delivering high-quality training programs. With years of experience in the industry, their instructors are experts in their field and have a deep understanding of Microsoft Access.
  2. Comprehensive Curriculum: The Microsoft Access training courses at Intellisoft Systems are designed to provide you with a comprehensive understanding of Access. From database design fundamentals to advanced query and reporting techniques, you’ll cover all aspects needed to become proficient in Access.
  3. Hands-on Learning: Intellisoft Systems places a strong emphasis on hands-on learning. Through practical exercises, real-world projects, and interactive workshops, you’ll gain practical experience that is invaluable for applying your knowledge in real-life scenarios.
  4. Customized Approach: The training courses are tailored to meet the needs of learners at various skill levels. Whether you’re a beginner or looking to enhance your existing Access skills, Intellisoft Systems ensures that the training aligns with your learning goals.
  5. Small Class Sizes: With small class sizes, you’ll receive personalized attention from instructors. This facilitates a conducive learning environment where you can ask questions, engage in discussions, and receive individualized guidance.
  6. Project-Oriented Learning: Intellisoft Systems believes in project-oriented learning, where you’ll work on practical projects that simulate real-world scenarios. This approach helps you build a strong foundation and apply your skills effectively.
  7. Practical Applications: Access is a powerful tool with numerous applications across various industries. By joining Intellisoft Systems’ courses, you’ll be equipped with skills that are highly relevant and sought after in the job market.
  8. Networking Opportunities: Enrolling in these courses allows you to connect with fellow learners who share similar interests. Networking opportunities can lead to valuable connections, collaborations, and the exchange of insights.
  9. Post-Training Support: Intellisoft Systems continues to support you even after the training is complete. You can reach out for clarifications, guidance, and assistance, ensuring that your learning journey is a continuous one.
  10. Proven Success Stories: Many individuals have successfully completed Intellisoft Systems’ Access training courses and have seen tangible improvements in their skills and career prospects. You could be the next success story.

If you’re looking to master Microsoft Access and unlock its potential for your personal growth or professional advancement, Intellisoft Systems’ Access training courses are your ideal choice.

With their experienced instructors, comprehensive curriculum, hands-on learning, and commitment to your success, these courses provide the perfect platform to enhance your skills and confidently navigate the world of Access.

Don’t miss out on this opportunity to learn from the best – join Intellisoft Systems’ Microsoft Access training courses and take your skills to the next level!

From Data Frustration to Data Transformation: A Success Story

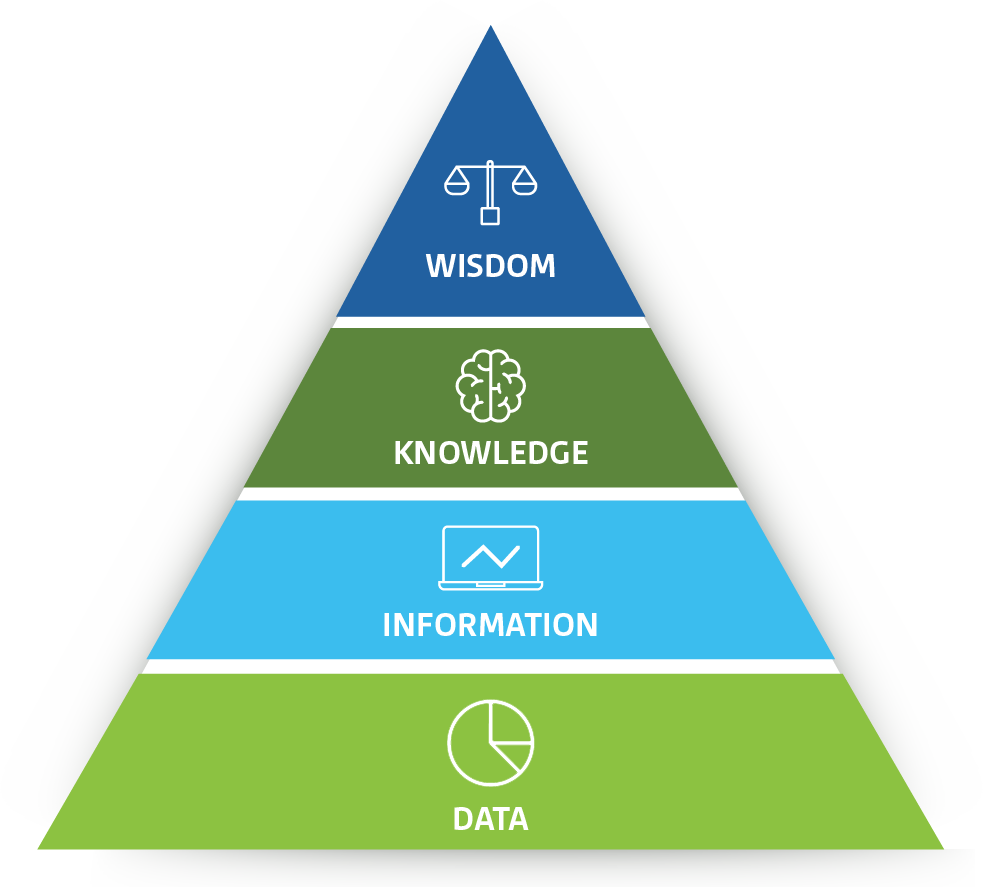
Learn to convert data into information into knowledge into wisdom at Intellisoft Systems Singapore

The Challenge of Having Too Much Data & Too Little Time

In today’s data-driven business landscape, the ability to extract meaningful insights from vast amounts of information is crucial. The amount of data that is coming is too fast, and there is hardly any time to analyze it.Learn to convert data into information into knowledge into wisdom at Intellisoft Systems Singapore

This challenge is faced by too many people… But there is light at the end of this black hole of data… See how our heroine, Amanda Lee managed to solve this challenge.

We take you on a captivating journey with Amanda, an employee who faced a daunting challenge: analyzing complex data from SAP.

Her determination, resourcefulness, and expertise in SQL, Excel, and Power BI led her to become a valued data analyst within her organization.

Let’s delve into the Case Study of Amanda and explore the transformative power of these tools, and how Amanda managed to survive the day and thrive…

The SAP Data Conundrum:

Amanda, a dedicated employee known for her analytical skills, was tasked by her manager to analyze data from SAP, the company’s backbone for managing vital business information.

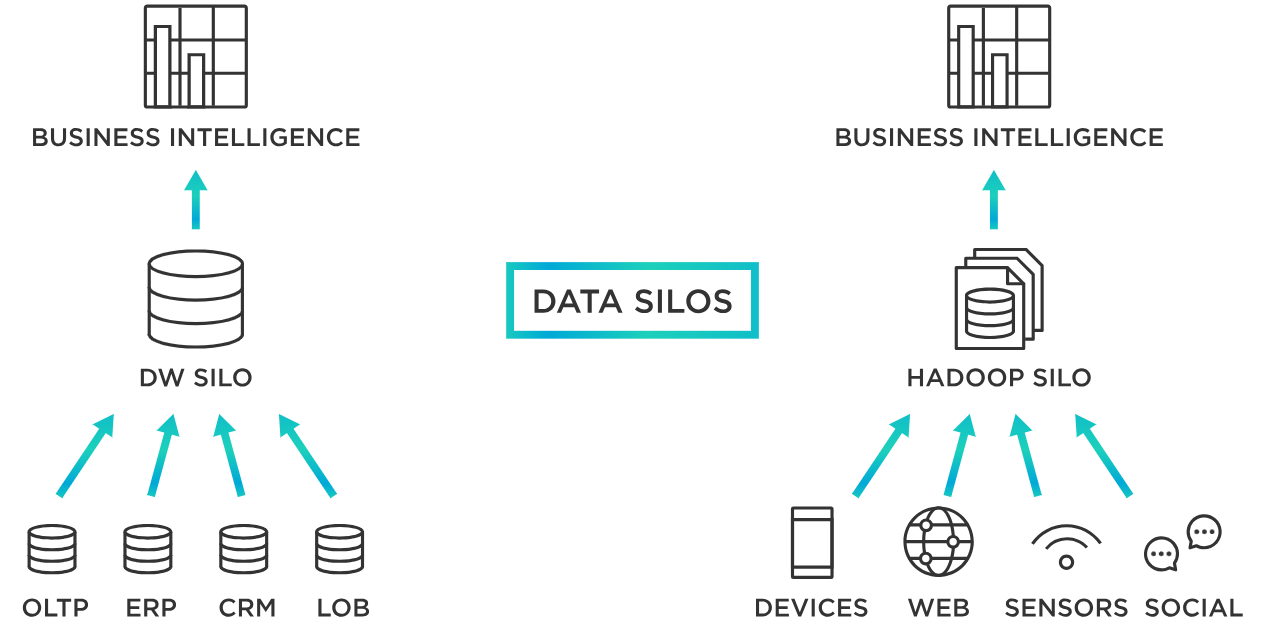
The data was available in multiple places in some standard reports, and some custom reports.Data in multiple silos can be combined with Power BI, SQL, Python. Learn how to do this at Intellisoft Courses in Singapore.

But the manager wanted a perfect report, and it was difficult to make sense of the whole, big picture from multiple sections.

So Amanda was tasked to take this challenge and make it work.

The challenge lay in finding a single report that provided a comprehensive overview of the required data. Undeterred, Amanda set out to conquer this data conundrum.

Exploring Standard Reports:

Amanda embarked on a meticulous exploration of SAP’s standard reports, hoping to find the perfect report or a solution.

She dedicated countless hours to examining various reports, seeking the elusive comprehensive data set.

However, despite her best efforts, none of the reports met the boss’s requirements.

Exporting and Excel Limitations:

Not one to give up easily, Amanda decided to export the data from SAP Reports into Excel, believing it would allow her to manage and analyze the information more effectively.

To her dismay, the exported data turned out to be massive, exceeding the limits of Excel’s capabilities. It became evident that relying solely on Excel would not suffice to solve this complex data puzzle.

Plus, loading multiple huge report files, and other Master data files at the same time caused her computer to crash often.

Excel and the Power of VLOOKUP:

Determined to find a solution, Amanda delved deeper into Excel’s functionalities and discovered the power of VLOOKUP.

She realized that by merging data from multiple sources, she could create a more comprehensive dataset. This process, however, proved to be laborious and error-prone, requiring significant time and effort to align the data properly.

Excel VLookup Sample

Learning VLOOKUP is one thing, and applying it to lookup multiple codes & descriptions from multiple sheets and multiple Excel files was too cumbersome and slow.

Discovering SQL:

Driven by her desire for efficiency, Amanda set out on a quest to find a more robust solution. She began exploring the world of databases and stumbled upon SQL (Structured Query Language).

Recognizing its potential in handling large datasets and performing complex queries, Amanda dedicated to mastering SQL language.

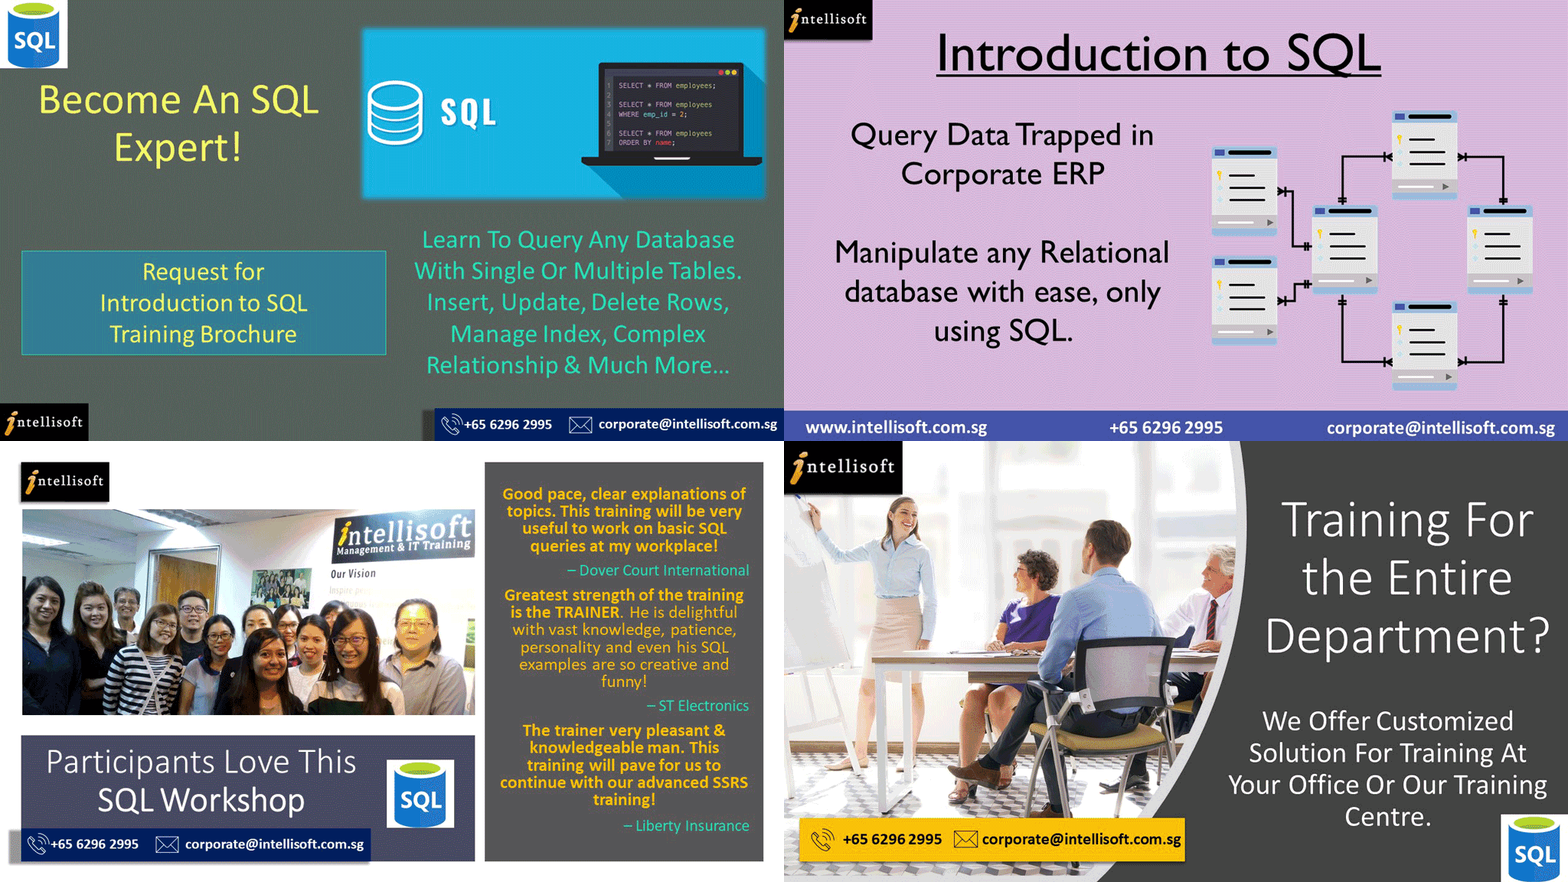
Learn SQL to query any database quickly in Singapore
Introduction to SQL training in Singapore. Learn to query any database with SQL quickly in 2 days at Intellisoft

Learning SQL helped in picking the right data directly from transactional tables in SAP’s Oracle Database by joining several table and writing efficient SQL queries.

The SQL Solution:

Armed with SQL knowledge, Amanda devised a strategy to extract the required data needed from the corporate SAP database.

With a single SQL query, the query effortlessly pulled out the required information, bypassing the arduous process of manual data manipulation.

Amanda’s achievement in harnessing the power of SQL marked a significant turning point in her quest for analytical excellence.

Excel Dashboards and Visualizations:

With the right data finally at her disposal, Amanda exported it back into Excel, now equipped with the necessary insights.

She utilized Excel Dashboards to create various analyses and visualizations, bringing the data to life in a meaningful and impactful way.

The management was astounded by the depth of insights provided by these visualizations, realizing the untapped potential of data analysis.

Introducing Power BI:

The success achieved with Excel Dashboards paved the way for an even more remarkable transformation. Amanda was introduced to Power BI, a powerful business intelligence tool, by the Corporate HQ of the company.

She was spellbound by the dynamic, beautiful, amazing analysis capabilities of Power BI.

She began to migrate the entire solution from Excel to Power BI, creating interactive dashboards and reports that enabled the entire organization to access and explore the latest data analysis  effortlessly, from any device, without waiting for manual data refreshes and month end jobs to complete running.

Becoming the Data Analysis Expert:

Amanda’s expertise in SQL, Excel, and Power BI elevated her to a coveted position within the company.

She became the go-to analyst for senior management, constantly engaging in discussions and providing innovative solutions to analyze and visualize information for the leadership team.

Her journey from an individual contributor to a key player in shaping data-driven decisions exemplified the transformative power of mastering these tools.

Conclusion:

The story of Amanda’s journey from grappling with SAP’s data challenges to becoming an indispensable data analysis expert is a testament to the incredible possibilities offered by SQL, Excel, and Power BI.

By harnessing the power of these tools, individuals can unlock the true potential of data, transform their organizations, and become drivers of analytical excellence in the ever-evolving business landscape.

What Challenge Are You Facing?

Are you facing similar challenges? Or do you have other data challenges?

Do let us know. Our experienced training coordinators can assist you in understanding your data challenges and then guide you with an appropriate course to choose from.

This can help you get started in the right way, and not face the challenges that Amanda faced.

Cheers,

Vinai Prakash, Founder & Principal TrainerIntellisoft Systems

Recommended Reading:

What is SQL & Why You Should Learn It

Learn SQL to query any database quickly in Singapore
SQL training in Singapore

SQL stands for Structured Query Language. It is the language used to interact with any RDBMS (Relational Database Management System) like Oracle, SQL Server, MySQL, PostgreSQL.

Attending a SQL training course will teach you how to query SQL databases, step by step. The most common types of requests are where you want to pick out some rows or records from a database table. You want to analyze data yourself.

To extract the data from any database, we can write a SELECT query, to extract that data from the table within the database.

A single table SQL query is pretty easy to write. It almost reads like English. You can qualify which columns you want, and what you want to filter out, based on your criteria.

Once you execute the query, the results from the database are picked up and displayed almost instantly. Retrieval of SQL data from a database is usually extremely fast.

A multiple-table SQL query requires you to understand the relationships between the different tables within the database, the primary key and secondary keys of the various tables, and then carefully do the joining of the common fields between the different tables.

Learn SQL to query any database quickly in Singapore
Introduction to SQL course in Singapore. Learn to query any database with SQL quickly in 2 days at Intellisoft Systems Singapore.

Once the common fields are linked between the tables, a data model is created. The common fields help to essentially create a long flat row, where you can pick any columns (or field) from any table in the combined row. This is the power of SQL. It is the reason almost everyone wants to learn SQL.

Multiple table queries are more useful, and they are similar to writing multiple VLOOKUPs in Excel to get to the Master & Transaction data in a single row.

Writing Multiple table SQL queries is where most people get stuck… because of the various ways to join – right join, left join, inner join, outer join etc.

This is where attending a SQL Training Course comes in handy. By joining a short 2 day SQL workshop, you can understand the fundamentals of SQL.

You will be able to do use these SQL Commands after attending a SQL workshop in Singapore:

  • How to insert data into a database table with the SQL INSERT statement,
  • how to delete records from any table by writing a SQL DELETE statement.
  • how to modify any data in any table within the SQL Database using the UPDATE statemet,
  • how to retrieve any number of columns from a single or multiple related tables, based on any selection criteria, with the SELECT SQL Statement.

If you can attend a classroom training course for SQL, I would seriously recommend it. The reason is that in a Classroom SQL Course, you can ask questions on the spot, and there is an expert SQL trainer to assist you too.

Check out our SQL Training Course in Singapore for Classroom Training

In our most popular SQL course in Singapore, we cover SQL statements like SELECT, INSERT, UPDATE, DELETE, CREATE TABLE, CREATE INDEX, CREATE VIEW, DROP, JOINS, and much more.

SQL is a very standard language, simple & business-like. It is like talking to someone in English. Pretty simple & straightforward. And it does not feel like learning a new language. It is pretty intuitive and easy to learn. A two day SQL workshop is more than sufficient to get you going on your journey to pick any data from your corporate databases.

A standard SQL based on the American National Standards Institute ANSI is best because you can then apply the standard SQL on any ANSI Relational Database.

The version of SQL is not really important, as most modern SQL database systems are up to date with the latest ANSI standards.

What is SQL & Why You Should Learn SQL

Click & Find Why You Should Learn SQL

Is Microsoft Access Still Relevant Now?

Microsoft Access Training in Singapore

Large companies can use the corporate databases hosted on expensive servers, and then get multiple database administrators, server administrators to manage the servers.

Startups, small businesses, SME companies cannot afford these luxuries.

For simple to complex, single user or multiuser database applications, most solopreneurs, and SME companies rely on Microsoft Access. It is well suited, proven and highly relevant even in 2021.

We have several reasons to say that Microsoft Access is still a truly relevant Database system even in this year, in fact many more years to come.

Let us look at what Microsoft Access is

Microsoft Access is Relational Database Management System (RDBMS) from Microsoft that combines the relational Microsoft Jet Database Engine with a graphical user interface and software-development tools to build Forms, Queries and Reports.

This is ideal for getting started in building a Customer Database, Accounting System, Warranty Tracking System, Order & Inventory Tracking etc. easily.

Microsoft Access stores all database tables, queries, forms, reports, macros, and modules in the Access Jet database as a single file.

  • Developed by: Microsoft Corporation
  • Latest version: 16.0

Advantages of Microsoft Access

  • Only one installation needed (RDBMS and design implement in one simple package)
  • Easy to install
  • Easy to integrate
  • Cost wise, it is way much lower. It is possibly already included in your Microsoft license.

Now, coming back to the question, Access applications are still in use longer than 20 years and people are building newer, mission critical applications using Microsoft Access.

Microsoft Access is still a viable tool for personal or small workgroup applications. The small business is not going to spent thousands on a software project that will take a year or more to develop.

Access has always been denigrated by mainline IT people almost from the beginning because it gives people control, which takes that control away from the IT department.

It has multiple uses and is used worldwide. The Danish government uses an Access app for contact tracing of COVID cases.

And in Singapore, Access is truly relevant and used every day by thousands of companies and individuals.

So yes, if you need to develop a database for personal use or within a workgroup, it is still highly relevant.

Get started today in using Microsoft Access for your next Database Project!

P.S: Check this out to know if you are Microsoft Office Proficient.

Microsoft Power BI: Super Charge Your Data Analysis Process

Learn Power BI for Data Analysis at Intellisoft Singapore

Do you analyze data? Whether you work in Sales, Finance, Manufacturing, Logistics, Engineering or Customer Service, there is a constant need to analyze data.

With the advent of the industrial age and the conveyor belt, gaining efficiency and reducing  errors has been a constant battle. We need more and better ways to analyze data. Today, billions of new data points are gathered every minute. There is more storage available in the cloud, and there is no dearth of computers big and strong enough to process it quickly.

Yet, there is a lack of know how, a lack of understanding on how to analyze data. As a result, more companies are still not able to tap on the promise of Big Data, Artificial Intelligence, Internet of Things or Machine Learning.

To Understand the State of Data Analysis, and look at solutions, we need to understand a few fundamentals about Data, and Data Analysis.

Why Do We Want To Analyze Data?

Duh!

Of course there are a gazillion reasons.

No… Not really. The need to analyze data is routed in only a few basic reasons.

  1. To Gain Insights about our data. Why?
    • So that we can find out what works, and what does not. So we can compare the past results with another company, another product, another period, and see if there is some insight to glean.
    • When we find out what works, and find out where the problem lies, we can then perform Root cause analysis – which can tell us the real problem to fix. When we have fever, we can take a tablet of Paracetamol (Tylenol/Panadol/Aspirin).

      However, the fever is not the disease. It is a symptom that we develop, when something is not right with our body, and the body is fighting the bad bacteria/virus. During this fight, the temperature rises. The Paracetamol can reduce the fever, but it does not remove the fight.

      To go to the root cause of the problem, a visit to the doctor is required. The doctor may analyze the problem by looking at your Blood pressure, heart rate, x-ray, probes etc. and figure out the issue. If it is indeed bad bacteria causing some area to swell, the doc can issue a dose of Anti-biotics, which fight the bad guys, and treat the real problem.

      Once the bad guys are gone, the fever automatically comes down to the normal level.

  2. Make Better & Faster Decisions
    • Based on the insights, we are able to make better decision, and faster too.  And backed by data, we can have more confidence on our decision making process… rather than relying only on the gut-feeling.
    • With statistical methods of analyzing data and forecasting trends, the accuracy of the analysis, and insights gets deeper as we generate better analytics. We can then make a more informed decisions faster.

How Do We Analyze Data: The Traditional Data Analysis Process

The data analysis process is simple, and we have been following it for so long that it has almost become a habit… albeit a not so good habit. What we usually do is outlined below:

  1. Get the Raw Data File From The Source System
    • This could be a Text File, a Comma Separated Values (CSV) File, a PDF file, an SQL data dump, an Access or RDBMS source (think Oracle, Microsoft SQL Server or MySQL Database)
  2. Load into Excel
    • Load this data into Excel. This could be easily achieved, but this is a manual process, that has to be repeated every day, week, month etc., whenever the data changes, or new data arrives.
  3. Clean
    • Incoming data is seldom clean. There will be missing values, duplicates, wrong headers, mis-aligned dates in YYYYMMDD or some other odd text or  numeric layout, and other data issues to fix.
    • To do this, you’ll have to write some simple formulas, functions, data cleanup steps, fix dates, and fill blanks or nulls with an appropriate values. This is all manual process, unless automated with the help of macros.
  4. Lookup Master Data
    • Once the data is cleaned-up, we need to change the codes with values, get the correct product price, employee salary, or the date of manufacture from some master data tables. This often requires expertise with Excel formulas like VLOOKUP & HLOOKUP.

      You may have to do some interim calculations too, create some calculated columns, and create a wide table with all the fields/columns required for the analysis in the next step.

  5. Create Pivot Tables
    • To analyze the data, one of the quickest and fastest ways is to create a Pivot Table. Pivot Tables help you to summarize data – create Sum, Count, Differences, Cumulative Totals etc. and split it by the Rows & Columns.

      Further, you can create multiple Filters or Slices using the Filters or Slicers options.

  6. Keep Refreshing
    • By default, a Pivot Table does not refresh automatically. You have to either set up this option, or refresh manually.

      And even if you refresh it either way, it may not pick the additional, new data, for the range of the source data may be set explicitly to an Absolute range.

      Changing the Absolute range always is an extra step that you have to remember to do.

  7. Create Charts
    • To present the data, we mostly rely on the popular Bar Charts, Column Charts, Pie Charts, and the newly introduced Map, Funnel or Tree map charts.

      However, charts often get too busy, and there are not too many options to customize them.

      Once the charts are ready, you don’t want to send the entire Excel file, with the charts. And sending only the charts is not an option, without the underlying data.

      This brings us to the next point…

  8. Paste Charts Into PowerPoint
    • PowerPoint is the darling of the corporate boardroom.

      No presentation is ever complete without a mega slideshow. So people use Excel to analyze the data, and the paste the charts into PowerPoint.

      They create hundreds of slides, and then marvel at their slide deck. Finally, they are ready for the big presentation to the directors.

  9. Present to Management using PPT Slides
    • The PowerPoint show begins, and your audience is thrilled by your analysis, prestation and charts. You are secretly gloating over the success. Suddenly a member of the audience has a question – can you compare this quarter with a quarter 5 years ago?
    • Well… yes you can. But you don’t have the data right now.

      You’ll have to get back to your desk, do the right analysis, and probably show them the chart in your next quarterly meetup.

    • The opportunity window is so small, by the time you get back to them, they probably do not need the information any longer. You have to cut a sorry figure, and all your great work comes to nothing…

What’s wrong with this whole scenario. Let’s find out.

Problems With Traditional Approach To Data Analysis

There are a number of major problems in the Traditional approach of Data Analysis that has been around for the past 20-30 years… pretty much all along the advent of Spreadsheets. To name a few:

  • Excel Charts and Reports Are Not Interactive
    • Traditional Excel or PowerPoint Reports/Charts are not interactive. They are just screen shots. So they don’t change dynamically. Good because it will always be the same, and speed of execution will be fast. Bad because it can’t be used again… And has to be manually refreshed each time.
  • You Can’t Share Excel Files Easily
    • People are worried when it comes to sharing their Excel files. They have security, and privacy concerns. And an Excel file is quite fragile. Change of any path, sheet, formula or cell can break the workings completely, rendering it completely useless.
  • Excel VLookups are Slow & Cumbersome To Use
    • Excel files rely on Vlookups to pick the correct employee salary, product description attributes, or prices. It works great, and has been the mainstay for Excel’s popularity. However, VLookups recalculate extremely slowly on a linked Excel file, which has anywhere in excess of 200,000 records. At half a million, things absolutely come to a standstill, and many times Excel will give you the dreaded Blue Screen and simply crash.
  • Excel Takes Time to Clean & Refresh every time
    • Newly added data has to be cleaned up. It takes time, and is a slow, painstaking process. If you forget to update, or refresh on time, it shows old/wrong data and is a complete waste. New data has to be added, and refreshed each time.
  • Security of Excel Data is Quite Fragile
    • Sending Excel reports without the data is simply not possible. And sending it with data raises Security concerns. Any leaks will destroy your pricing, and lose your competitive advantage. And any broken links will render the data useless too.
  • A Very Small, Finite Limit of Excel Rows
    • There is only a finite number of rows that can be loaded into Excel. The current limit is a million rows (1,048,576 to be exact.). But in today’s world, a million rows is considered nothing. We need to look at ways to expand the limit to millions of rows.
  • Pivot Table Limitations
    • Pivot tables are quite slow to refresh. Further, they do not refresh automatically. And, there are very few ways to visualize the data – only sum, count, average, and YTD etc. It lacks the rich data transformations like Year on Year, Quarter on Quarter Analysis. It is not very good at showing the total overall percentages and its breakdowns.
  • Wasted Time in Cleanup
    • 80% time is spent  to clean the data, and only 20% is left for us to analyze it. This does not accord the time and importance data analysis requires. The equation is completely skewed out. It should be the other way round – 20% to clean, and 80% time for analysis.

Is There A Solution To All These Data Analysis Woes?

With the current state of Business Intelligence Tools, there is more than a glimmer of hope. The industry has finally arrived to a point where Big Data processing is becoming commonplace, and is no longer in the realm of the wealthy or the academics. Today, the common man’s BI tools are already working wonders.

  • Need for Interactive System
    • Today, the top of the breed BI tools like QlikView, Tableau and Microsoft, all offer dynamic ways to present data, and interactive ways to visualize it, in numerous ways.
  • Write Once. Use Again.
    • Now the steps of cleaning the data can be recorded, and used again and again, each month with hardly any tweaks. This reduces the need for manual cleanup and improves accuracy and reliability. It offers ways to scale up the data analysis process and work on more value added services.
  • Shift Cleanup vs Analyze Ratio to 20-80.
    • With the added interactivity and automation, finally more time can be spent in analyzing the data. Cleanup jobs are set in the background, and they can continue to run on auto-pilot. Plus, we are able to process data now in real time, which drastically improves the prospects of having usable, actionable data and insights.
  • Load Data From Multiple Sources
    • The ability to load and merge data from multiple sources is becoming much easier, and automation is making this chore into a breeze that is a fun to do activity today.
    • Data from Text files, CSV, Excel, Databases, XML, Websites, Live Tickers, On and Off site Corporate Data Warehouses is becoming a reality. This opens up new possibilities.
  • Remove need to do complex, slow VLookups
    • Forget slow VLookups, and be able to lookup any row, any column, irrespective of the order or distribution of the data rows and columns. This frees up new options and makes merging data a simple matter. In fact, now we do not need to have very wide tables..

      We can have shorter (Less wide – less number of column in a table And  have taller tables (More data rows)

    • For Tips on Data Modeling, read our Data Modeling Considerations in Power BI.
  • Load Huge Data Volume, beyond 1 million rows of Excel
    • Options like Microsoft Power Query & Microsoft Power Pivot enable you to load a few million rows a simple matter. And there is no need to worry about running out of space in Excel or its bandwidth – the ability to process a few million rows.

Microsoft Power BI: The Magic Wand To Vanquish All Your Data Analysis Problems

  • Super Fast
  • Dynamic, Interactive
  • Handle Big Data With Ease
  • Hundreds of Data Sources
  • Build Relationships. End of VLookups
  • Multiple Ways to Refresh
  • Visualize First
  • Generate Insights
  • Share With Ease
  • New Ways to Visualize – Maps, Tree Maps, Funnels, KPIs, Speedometers
  • Security of Sharing
  • Multi Device Support – Web, Desktop, Mobile, Tablet, Without installing any additional software
  • Real Time Processing
  • Multiple Dashboards
  • Slice & Dice To your Heart’s content

Article Written by Vinai Prakash, MBA, PMP, GAP, ACTA Certified

Additional Resources for Power BI

Training Courses

Data Analytics & Visualization with Power BI

Learn Microsoft Power BI Suite For Better Data Analysis & Reporting

Power BI Tips, Tricks & Video Tutorials

Power BI Tip #2: Reference Query Results in Another Query With Power Query [Video Tutorial]

Microsoft Power BI: Super Charge Your Data Analysis Process

Power BI Tip #6: Fixing The Vertical Axis in Power BI Visualisations

Power BI Tip #5: All About Slicer Controls in Power BI

Power BI Tip#4: Enter Data Into Power BI Quickly [Video]

Power BI Tip #3: Quick Formatting of Power BI Visuals

Why Learn Python For Data Analysis: An Eye Opener

Learn Python for Data Analysis at Intellisoft Singapore

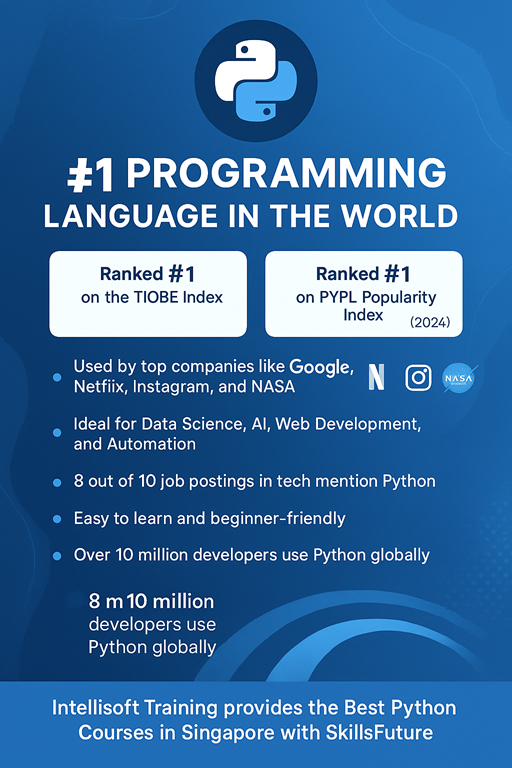
Python Popularity

Python - Number 1 Programming Language
Python – Number 1 Programming Language

Wondering Why Learn Python?

The workplace has already changed. As technology continues to rapidly transform industries & jobs, staying relevant & competitive requires continuously updating, diversifying, and building completely new skill sets.

Today, Data analysis is no longer the job of IT folks. Everyone is required to analyze the past, adapt to change, and forecast the future. The ability to do so well is increasingly what will keep your job.

Learn Python & Stay Relevant

Python is a great programming language for data science and general data analysis. It is open-source & free to download for anyone, unlike commercial tools like SAS or SPSS. Find out why you must learn Python for your current & future jobs.

Purpose of Learning Python

It is suitable for almost any data science task, from data manipulation and automation to ad-hoc analysis and exploring datasets.

Python is easy to learn, even for complete beginners. You don’t need a background in IT or computer science.

Python Training in Singapore is available for you to get started asap.

Who Uses Python & Why You Should Learn it?

Python is used by people that want to go deeper into data analysis or apply statistical techniques, and by most people who turn to data science.

Python is a production-ready language, meaning it has the capacity to be a single tool that integrates with every part of your workflow!

Why Learn Python Programming
Why You Must Learn Python Programming To Stay Ahead

Why Learn Python: It’s Usability is Great

Whether you work in Manufacturing, Services, Banking, Finance, Logistics, Telecom, Marine, Oil & Gas, Shipping, IT or any other industry, you’ll be able to apply Python to everyday work. And people with a software or engineering background may find Python comes more naturally to them.

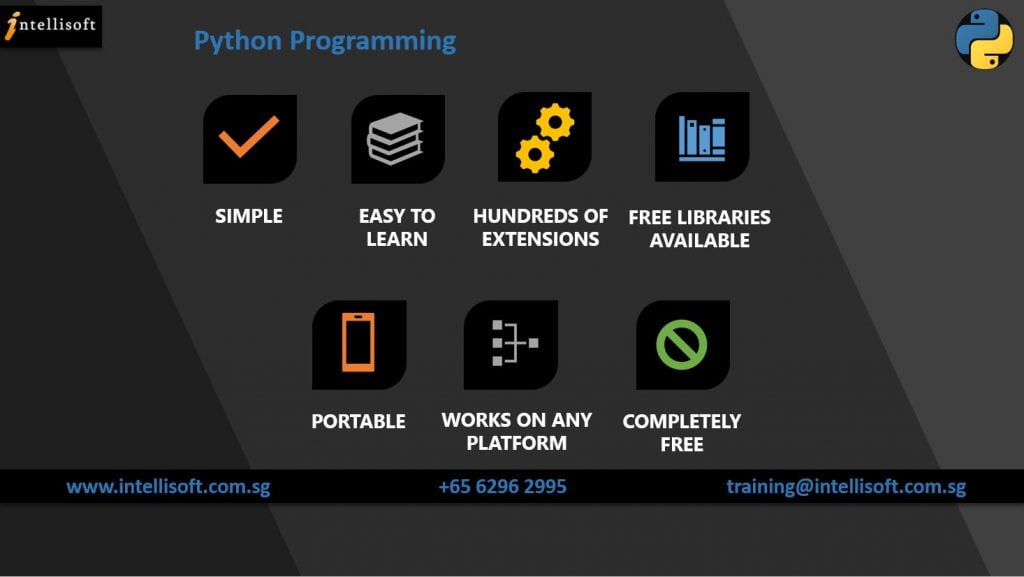
  • Coding and debugging is way easier than other programming languages because of the simple syntax of Python
  • Python has a robust ecosystem and is commonly considered one of the easier programming languages to read and learn. Its programming syntax is simple and its commands mimic the English language.
  • Python code is syntactically clear and elegant, easily interpretable, and easy to type.
  • It’s great for building data science pipelines and machine learning products integrated with web frameworks at scale.

Why Learn Python: It’s a Flexible Language

Python is flexible for creating something that has never been done before.

You can also use it for scripting websites, Clean or Scrape Web Data, Merge data from multiple sources, and create games & other applications easily.

Why Learn Python: It is Extremely Easy To Learn

Python’s focus on readability and simplicity means its learning curve is relatively linear and smooth. With this, you can see the difference as you begin to learn Python. Once you know the basics of Python, you should go for Python For Data Analysis Training in Singapore

Python is considered a good language for beginners. No wonder it is the Number 1 Programming language in the world.

Python Programming Training Singapore

Advantages of Python Over Other Languages

  1. General-purpose programming languages are useful beyond just data analysis.
  2. Python has gained popularity for its code readability, speed, and many other functionalities too.
  3. It is great for mathematical computation & learning how algorithms work.
  4. Python has high ease of deployment and reproducibility.

Popular Libraries and Packages

  • pandas to easily manipulate data
  • SciPy and NumPy for scientific computing
  • Scikit-learn for machine learning
  • Matplotlib and seaborn to make graphics & charts
  • statsmodels to explore data, estimate statistical models, and perform statistical tests and unit tests

Getting Started in Python

There are many Python IDEs to choose from which drastically reduce the overhead of organizing code, output, and notes files.

Jupyter Notebooks and Spyder are 2 such popular IDE that we use to teach Python at Intellisoft.

Learn Python Step-By-Step: Instructor Led Training

The best approach to get initiated with using Python is to go for our Step by Step, Beginner Course to introduce the Python Language to you.

With an experienced and knowledgeable instructor, you can learn faster. Our fantastic trainers are ready to explain simple to complex topics with ease. It will be a much better experience.

Plus, attending training will significantly reduce the learning curve, and you will thank yourself for having a quick and rapid start to learning the world’s most popular language – Python.

Contact Us for our Python Training Programs.

Call +65-6250-3575 or email training@intellisoft.com.sg for a Python course brochure.

Article Written By: Vinai Prakash, Intellisoft Systems

Free Tips, Tutorials & Training Grants Info

Learn from expert tips, tricks and resources for Excel, PowerPoint, Photoshop, Python, Power BI, Project Management, IT, Soft Skills & more with our Email Newsletter.
Plus get the latest news on Grants. Join Today!

Found What You Were
Looking For?

Just Tell us...

We're Here To Help You!