
Up to 70% WSQ Funding & SkillsFuture Credits Eligible Course on Excel Analytics for HR Professionals in Singapore
Course Duration for Microsoft Excel for HR Training: 2 days
Unlock the power of data-driven decision-making with Excel for HR Professionals, a comprehensive 2-day hands-on workshop designed specifically for Human Resource executives, managers, and analysts.
In today’s fast-paced, metrics-driven workplace, HR teams must go beyond spreadsheets and truly analyze their workforce data to provide strategic insights. This workshop equips you with the tools, techniques, and confidence to clean, manage, analyze, and visualize HR data using Microsoft Excel.
You’ll learn how to calculate HR metrics, build interactive dashboards, use PivotTables for workforce analysis, and even perform hypothesis testing to validate HR strategies. From understanding employee turnover trends to visualizing recruitment funnels, this course will help you deliver clear, data-backed insights to management.
Led by a senior HR analytics expert, this course blends real-world HR scenarios with Excel’s practical capabilities, making it an essential upskilling program for modern HR professionals.

Excel for HR Professionals: 2-Day Practical Workshop – Course Outline
Empower HR decisions with Data-Driven Insights Using Microsoft Excel
Day 1: Foundations of Excel for HR Analytics
Module 1: Introduction to HR Analytics with Excel
- The role of HR analytics in modern workforce planning and decision-making.
- Overview of key HR metrics: turnover, absenteeism, training ROI, cost per hire, etc.
- How Excel supports people analytics in daily HR operations.
Module 2: Excel Basics Refresher for HR Teams
- Navigating Excel’s interface and layout.
- Best practices for entering, editing, and formatting HR data.
- Time-saving shortcuts and tricks tailored for HR scenarios.
Module 3: Managing & Cleaning HR Data
- Data formatting essentials: text, numbers, dates, currencies.
- Cleaning messy HR data using Text Functions in Excel like TRIM, PROPER, UPPER/LOWER, and SUBSTITUTE.
- Removing duplicates, fixing blank records, and using Flash Fill for smart entries.
Module 4: Sorting, Filtering & Conditional Formatting in HR
- Sorting multi-column HR data (e.g. tenure within departments).
- Advanced filters: finding employees with specific certifications or expiring contracts.
- Highlighting absenteeism, birthdays, or contract expiry using conditional formatting.
Module 5: Key Statistics and Descriptive Analytics for HR
- Understanding key statistical indicators: average, median, mode, min, max, standard deviation.
- Using built-in functions for Analysis using Average, Median, Mode, Standard Deviation: AVERAGE(), MEDIAN(), MODE.SNGL(), STDEV.P().
- Applying statistics to HR use cases: average age, training hours, salaries.
Module 6: Useful Formulas for HR Analysis
- Using IF, COUNTIF, SUMIF, AVERAGEIF for common HR calculations.
- XLOOKUP vs VLOOKUP: when and how to use each to fetch employee details.
- Introduction to trend analysis & forecasting in HR Data
Day 2: Advanced HR Analytics, Reporting & Dashboards
Module 7: Pivot Tables for HR Reporting & Analysis
- Creating PivotTables to analyze headcount, turnover, attendance.
- Grouping and binning by age, years of service, and salary ranges.
- Calculating % of total, count of hires by department, and more.
- Adding slicers for filtering by department, gender, or employment type.
- Hypothesis Testing in HR data
Module 8: HR Data Visualization with Excel Charts
- Choosing the right chart type for HR reports.
- Creating trend charts for attrition, headcount growth, or training hours.
- Combining multiple data series (e.g. budget vs actual training spend).
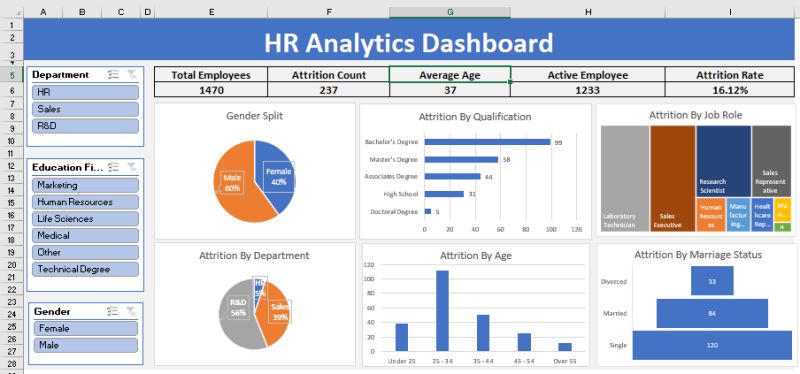
Module 9: Building HR Dashboards in Excel
- Elements of a good HR dashboard: KPIs, interactivity, simplicity.
- Creating interactive dashboards using slicers, PivotTables, and PivotCharts.
- Designing dashboards for recruitment, employee engagement, or manpower planning.
- Incorporating Excel form controls (drop-downs, checkboxes) to enhance dashboards.
Module 10: Working with Protected & Shared HR Data
- Locking specific cells, sheets, or workbooks to protect sensitive data.
- Using data validation for dropdowns in HR forms (e.g. job roles, departments).
Module 11: Real-World Case Studies & Practice
- Case 1: Employee turnover analysis and exit trend identification.
- Case 2: Performance appraisal summary using VLOOKUP & PivotTables.
- Case 3: Recruitment dashboard using slicers to filter by job level or location.
Target Audience
HR Executives, HR Analysts, Talent Acquisition Specialists, and HR Business Partners who want to enhance their Excel skills for real-world HR use.
Learning Outcomes
By the end of the course, participants will be able to:
- Organize, clean, and analyze HR data using Excel formulas and tools.
- Create PivotTables with binning and slicers to gain deeper insights.
- Apply descriptive statistics to identify patterns in workforce data.
- Build dashboards to communicate HR metrics and support strategic decisions.
Full of Practical, Hands on Exercises based on HR work. A Laptop for doing the exercises is provided in the class room for all participants. What are you waiting for? Register for Excel for HR Executives.
By the end of this 2-day workshop, participants will be able to:
-
Understand key HR metrics and their role in data-driven decision-making
-
Clean and prepare HR data for analysis using Excel
-
Apply essential Excel formulas like IF, XLOOKUP, COUNTIF, and SUMIFS
-
Perform basic descriptive statistics to summarize HR data
-
Use PivotTables with grouping, binning, and slicers for HR reporting
-
Create charts and dashboards to visualize workforce trends
- Build interactive HR dashboards with KPIs and slicers
-
Apply data validation and protection for secure HR reporting
-
Translate HR data into actionable insights for management
In just 2 days, HR Professionals will learn the tips that save hours to resolve the difficulties they face on a daily basis in doing employee compensations, salary, leave, benefits etc.
In this practical training, participants will learn formatting techniques to convert data from different sources, and how to make the best use of most important formulas for HR.
What will you get:
- Quality training is delivered by Microsoft Certified Trainers from the industry.
- Participants get the easy to read and understand manual specially designed for this course to take back for practice and future reference.
- All formulas and functions from these files could be directly used at workplace.
- Ability to ask questions on the spot and maximize your learning.
You can register online for the Advanced Excel for HR Training.
If you want to join our other Excel course in Singapore & improve your skills, we have multiple courses – Basic Excel for Analytics, Advanced Excel Courses in Singapore & VBA Macro Programming Courses.
This course is designed for: New and Experienced HR professionals from:
- Admin Professionals
- Compensation and Benefits Professionals
- HR Reward and Payroll Professionals
- HR Managers
- Anyone who perform HR functions in their organizations on daily basis
This course is extremely practical with multitude of hands on exercises that HR Executives will learn to apply in routine HR work and present meaningful information to the management. You can attend the HR workshop on Excel at Intellisoft Systems.
You must know the basics of using computer, and using elementary usage of Microsoft Excel.
This course is targeted towards HR Executives, HR Analysts, Talent Acquisition Specialists, and HR Business Partners who want to enhance their Excel skills for real-world HR use. If you have some HR background, or work in any function in HR, this practical and hands-on course on HR Analytics with Advanced Excel skills will be of great use to you and your organization.
After completion of the Advanced Excel for HR Analytics Training, you will be able to do the following easily:
- Calculate the tax deductible amount based on the different salary range.
- Display first name, last name with prefix in one single column from three different columns.
- Find years of service of employees.
- Find the total salary expenses in different regions, different departments.
- Total number of employees in the company in different departments.
- Find the total salary given to employees of a particular department or designation in a particular month.
- Find number of employees joined on particular date/month in any department in any country.
- Calculate the bonus based on overall performance of an employee.
- Find the number of leaves taken by any employee, find the designation of an employee from his salary.
- Count number of directors or any designation in a company.
- Display the records according to department, by hire date, by salary etc.
- Calculate the total overtime hours for employees for any month.
- View summarized salary for all the different countries in different departments.
- Set the status, department of an employee through data validation.
- Validate the hire date upon data entry.
- Calculate salary based on overtime hours.
- Calculate the net pay of an employee from his/her daily pay and leaves taken.
- Consolidate overtime hours and rate for two employees
- Compare employee’s involvement in department from the working hours using charts.
- Find total number of employees working in specific department from specific dates, and much more in this 2 day HR focused Microsoft Excel 365 workshop.
Post-Course Support
- We provide free consultation related to the subject matter after the course.
- Please email your queries to training@intellisoft.com.sg and we will forward your queries to the subject matter experts.
Venue:
All courses are conducted at Intellisoft Training Rooms at 190 Middle Road, 10-08 Fortune Centre, Singapore 188979.
Short walk from Bencoolen MRT, Bugis, Rochor, Bras Basah MRT stations. The venue is disabled-friendly. For directions, click Contact Us.
By the end of this 2-day workshop, participants will be able to:
-
Understand key HR metrics and their role in data-driven decision-making
-
Clean and prepare HR data for analysis using Excel
-
Apply essential Excel formulas like IF, XLOOKUP, COUNTIF, and SUMIFS
-
Perform basic descriptive statistics to summarize HR data
-
Use PivotTables with grouping, binning, and slicers for HR reporting
-
Create charts and dashboards to visualize workforce trends
- Build interactive HR dashboards with KPIs and slicers
-
Apply data validation and protection for secure HR reporting
-
Translate HR data into actionable insights for management
In just 2 days, HR Professionals will learn the tips that save hours to resolve the difficulties they face on a daily basis in doing employee compensations, salary, leave, benefits etc.
In this practical training, participants will learn formatting techniques to convert data from different sources, and how to make the best use of most important formulas for HR.
What will you get:
- Quality training is delivered by Microsoft Certified Trainers from the industry.
- Participants get the easy to read and understand manual specially designed for this course to take back for practice and future reference.
- All formulas and functions from these files could be directly used at workplace.
- Ability to ask questions on the spot and maximize your learning.
You can register online for the Advanced Excel for HR Training.
If you want to join our other Excel course in Singapore & improve your skills, we have multiple courses – Basic Excel for Analytics, Advanced Excel Courses in Singapore & VBA Macro Programming Courses.
This course is targeted towards HR Executives, HR Analysts, Talent Acquisition Specialists, and HR Business Partners who want to enhance their Excel skills for real-world HR use. If you have some HR background, or work in any function in HR, this practical and hands-on course on HR Analytics with Advanced Excel skills will be of great use to you and your organization.
After completion of the Advanced Excel for HR Analytics Training, you will be able to do the following easily:
- Calculate the tax deductible amount based on the different salary range.
- Display first name, last name with prefix in one single column from three different columns.
- Find years of service of employees.
- Find the total salary expenses in different regions, different departments.
- Total number of employees in the company in different departments.
- Find the total salary given to employees of a particular department or designation in a particular month.
- Find number of employees joined on particular date/month in any department in any country.
- Calculate the bonus based on overall performance of an employee.
- Find the number of leaves taken by any employee, find the designation of an employee from his salary.
- Count number of directors or any designation in a company.
- Display the records according to department, by hire date, by salary etc.
- Calculate the total overtime hours for employees for any month.
- View summarized salary for all the different countries in different departments.
- Set the status, department of an employee through data validation.
- Validate the hire date upon data entry.
- Calculate salary based on overtime hours.
- Calculate the net pay of an employee from his/her daily pay and leaves taken.
- Consolidate overtime hours and rate for two employees
- Compare employee’s involvement in department from the working hours using charts.
- Find total number of employees working in specific department from specific dates, and much more in this 2 day HR focused Microsoft Excel 365 workshop.
Excel for HR Professionals: 2-Day Practical Workshop – Course Outline
Empower HR decisions with Data-Driven Insights Using Microsoft Excel
Day 1: Foundations of Excel for HR Analytics
Module 1: Introduction to HR Analytics with Excel
- The role of HR analytics in modern workforce planning and decision-making.
- Overview of key HR metrics: turnover, absenteeism, training ROI, cost per hire, etc.
- How Excel supports people analytics in daily HR operations.
Module 2: Excel Basics Refresher for HR Teams
- Navigating Excel’s interface and layout.
- Best practices for entering, editing, and formatting HR data.
- Time-saving shortcuts and tricks tailored for HR scenarios.
Module 3: Managing & Cleaning HR Data
- Data formatting essentials: text, numbers, dates, currencies.
- Cleaning messy HR data using Text Functions in Excel like TRIM, PROPER, UPPER/LOWER, and SUBSTITUTE.
- Removing duplicates, fixing blank records, and using Flash Fill for smart entries.
Module 4: Sorting, Filtering & Conditional Formatting in HR
- Sorting multi-column HR data (e.g. tenure within departments).
- Advanced filters: finding employees with specific certifications or expiring contracts.
- Highlighting absenteeism, birthdays, or contract expiry using conditional formatting.
Module 5: Key Statistics and Descriptive Analytics for HR
- Understanding key statistical indicators: average, median, mode, min, max, standard deviation.
- Using built-in functions for Analysis using Average, Median, Mode, Standard Deviation: AVERAGE(), MEDIAN(), MODE.SNGL(), STDEV.P().
- Applying statistics to HR use cases: average age, training hours, salaries.
Module 6: Useful Formulas for HR Analysis
- Using IF, COUNTIF, SUMIF, AVERAGEIF for common HR calculations.
- XLOOKUP vs VLOOKUP: when and how to use each to fetch employee details.
- Introduction to trend analysis & forecasting in HR Data
Day 2: Advanced HR Analytics, Reporting & Dashboards
Module 7: Pivot Tables for HR Reporting & Analysis
- Creating PivotTables to analyze headcount, turnover, attendance.
- Grouping and binning by age, years of service, and salary ranges.
- Calculating % of total, count of hires by department, and more.
- Adding slicers for filtering by department, gender, or employment type.
- Hypothesis Testing in HR data
Module 8: HR Data Visualization with Excel Charts
- Choosing the right chart type for HR reports.
- Creating trend charts for attrition, headcount growth, or training hours.
- Combining multiple data series (e.g. budget vs actual training spend).
Module 9: Building HR Dashboards in Excel
- Elements of a good HR dashboard: KPIs, interactivity, simplicity.
- Creating interactive dashboards using slicers, PivotTables, and PivotCharts.
- Designing dashboards for recruitment, employee engagement, or manpower planning.
- Incorporating Excel form controls (drop-downs, checkboxes) to enhance dashboards.
Module 10: Working with Protected & Shared HR Data
- Locking specific cells, sheets, or workbooks to protect sensitive data.
- Using data validation for dropdowns in HR forms (e.g. job roles, departments).
Module 11: Real-World Case Studies & Practice
- Case 1: Employee turnover analysis and exit trend identification.
- Case 2: Performance appraisal summary using VLOOKUP & PivotTables.
- Case 3: Recruitment dashboard using slicers to filter by job level or location.
Target Audience
HR Executives, HR Analysts, Talent Acquisition Specialists, and HR Business Partners who want to enhance their Excel skills for real-world HR use.
Learning Outcomes
By the end of the course, participants will be able to:
- Organize, clean, and analyze HR data using Excel formulas and tools.
- Create PivotTables with binning and slicers to gain deeper insights.
- Apply descriptive statistics to identify patterns in workforce data.
- Build dashboards to communicate HR metrics and support strategic decisions.
Full of Practical, Hands on Exercises based on HR work. A Laptop for doing the exercises is provided in the class room for all participants. What are you waiting for? Register for Excel for HR Executives.
This course is designed for: New and Experienced HR professionals from:
- Admin Professionals
- Compensation and Benefits Professionals
- HR Reward and Payroll Professionals
- HR Managers
- Anyone who perform HR functions in their organizations on daily basis
This course is extremely practical with multitude of hands on exercises that HR Executives will learn to apply in routine HR work and present meaningful information to the management. You can attend the HR workshop on Excel at Intellisoft Systems.
You must know the basics of using computer, and using elementary usage of Microsoft Excel.
Post-Course Support
- We provide free consultation related to the subject matter after the course.
- Please email your queries to training@intellisoft.com.sg and we will forward your queries to the subject matter experts.

Learn Practical Skills
Companies sponsoring their staff for this Excel training will benefit from increased employee productivity.
Your team will learn the most useful formulas, shortcuts, tips & tricks to become good at using Excel at a Expert level.

2 Days Workshop
Enhance your team's efficiency and effectiveness with key Excel Skills
Contact us for advise on how to go about how to get started in learning Key Excel Skills for HR.
Get Started Today!

Learn By Doing
You learn best when you Do It Yourself.
We teach you, step by step, how you can learn new skills, build your knowledge and enhance your career prospects quickly & easily, with Practical Tips & Tricks!


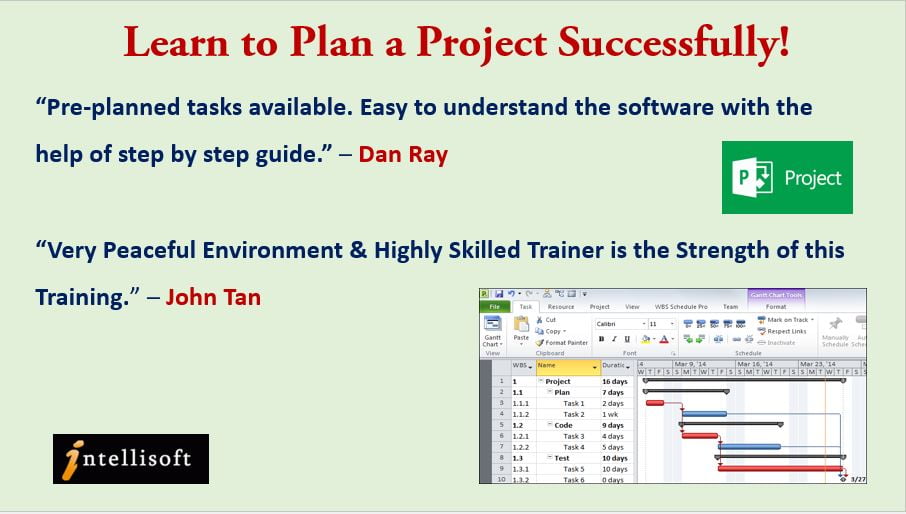


 Microsoft® Office Project Professional has an extensive range of easy to use shortcuts, tips and tricks, that will enable you to use it as a tool that assists in managing your projects effectively and efficiently.