Data cleaning is one of the most critical steps in any data analysis process. Without clean, structured, and reliable data, insights drawn from analysis can be inaccurate or misleading.
In Power BI, Power Query serves as a powerful tool that allows users to connect, transform, and clean data efficiently, ensuring that it’s ready for reporting and analysis.
Whether you’re working with messy datasets from multiple sources, dealing with missing values, or eliminating duplicates, Power Query provides a simple, yet robust interface to clean data with minimal coding.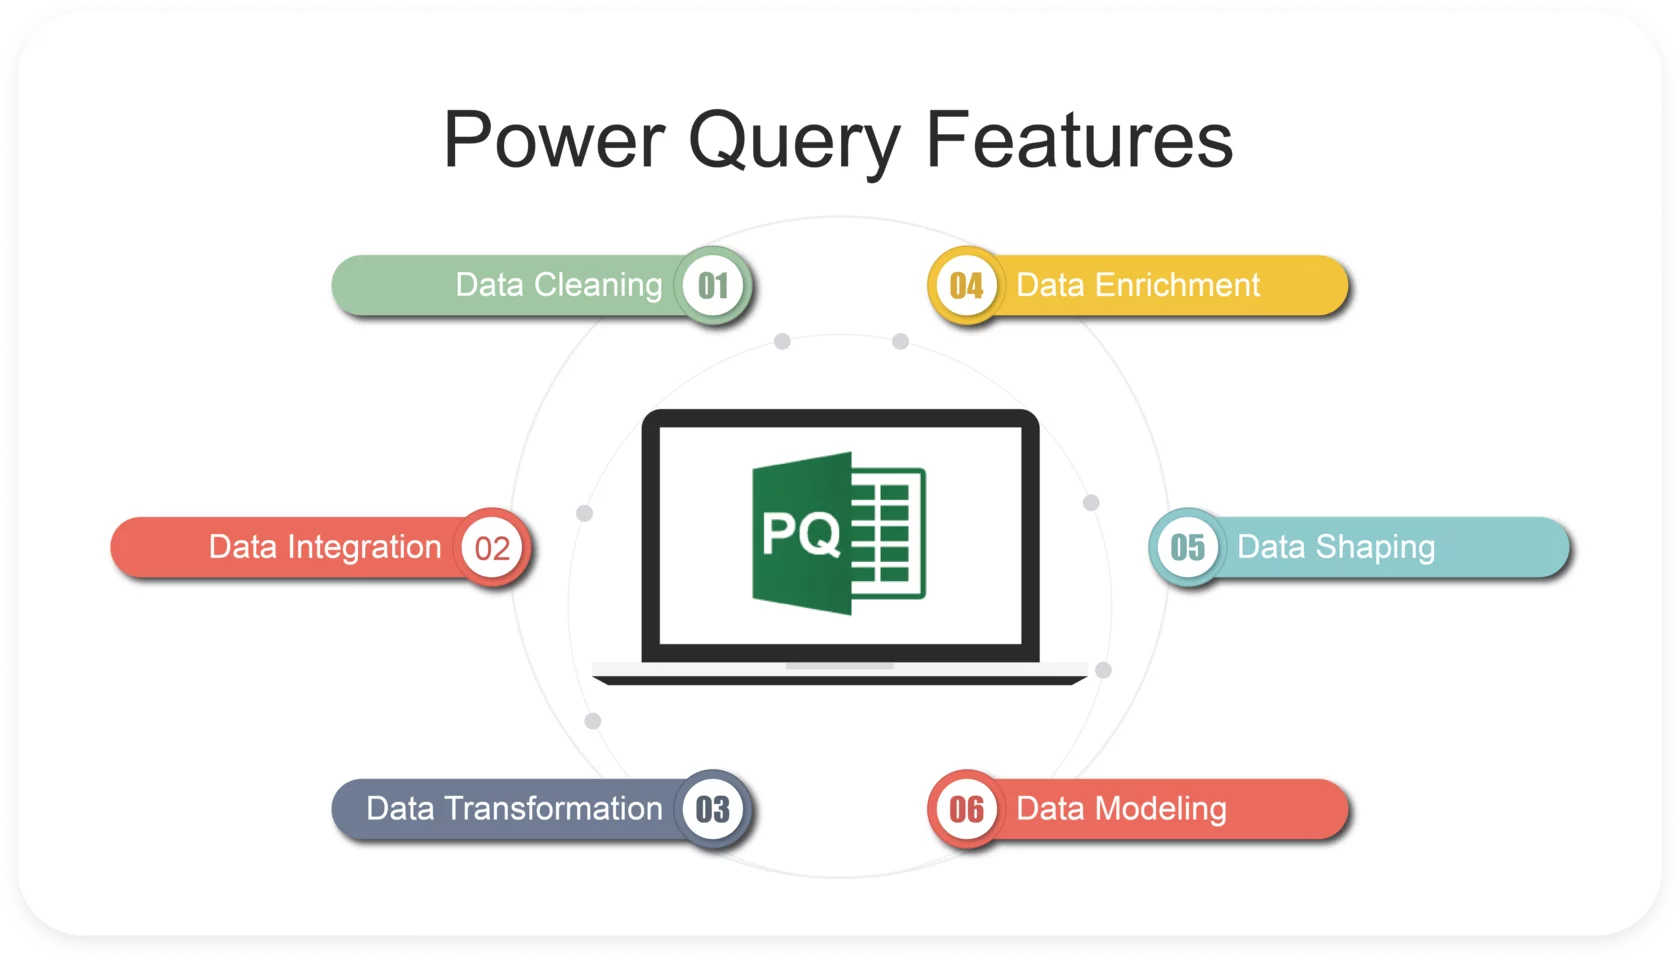
In this guide, we’ll walk through a 10-step process to clean data using Power Query, providing clear and actionable instructions to ensure your data is refined and ready for analysis.
10-Step Process to Clean Data Using Power Query in Power BI
- Load Data into Power Query
- Remove Unnecessary Columns
- Rename Columns
- Filter Out Unwanted Rows
- Handle Missing Values
- Change Data Types
- Remove Duplicates
- Trim and Clean Data
- Split and Merge Columns
- Apply and Load Data to Power BI
Step-by-Step Process & Details on How to Use Power Query in Excel / Power BI
1. Load Data into Power Query
The first step is importing your data into Power Query. This could be from an Excel file, SQL database, or other data sources.
- How to do it: In Power BI, click on Home > Get Data. Choose your data source and load the data into Power BI. Then click Transform Data to open Power Query Editor.
- Purpose: This step allows you to connect Power BI to your data source, bringing raw data into the environment for cleaning and transformation.
2. Remove Unnecessary Columns
Not all columns in your dataset are needed for analysis. Removing irrelevant columns helps streamline the dataset and improve performance.
- How to do it: Select the columns you don’t need, right-click, and choose Remove Columns.
- Purpose: This reduces the size of your dataset, making it easier to work with and removing noise that could affect analysis.
3. Rename Columns
Renaming columns improves readability and makes your dataset more understandable, especially when working with multiple datasets or sharing reports with others.
- How to do it: Right-click the column header and choose Rename. Alternatively, double-click the column name to rename it.
- Purpose: Clean, descriptive column names make it easier to recognize and use data fields in future transformations and analysis.
4. Filter Out Unwanted Rows
Filtering data ensures that only the relevant rows are kept for analysis. This is particularly useful when you have data entries like errors or outliers that can skew your results.
- How to do it: Click the dropdown arrow in the column header and apply filters based on conditions (e.g., removing rows with zero values, errors, or irrelevant categories).
- Purpose: Filtering reduces dataset size and removes irrelevant data, focusing on what’s important for your analysis.
5. Handle Missing Values
Data often has missing values, which can create issues in analysis. You can either remove rows with missing data or fill in values where appropriate.
- How to do it: Right-click the column and select Replace Values to fill missing data, or use Remove Rows > Remove Blank Rows to eliminate incomplete records.
- Purpose: This ensures your dataset is complete or that missing data is handled in a way that doesn’t negatively impact your analysis.
6. Change Data Types
Correctly assigning data types (e.g., text, number, date) is crucial to ensure that Power BI interprets your data correctly.
- How to do it: Select the column, then go to the ribbon, click on the Data Type dropdown, and choose the appropriate type (e.g., Decimal Number, Date, Text).
- Purpose: This avoids issues like date misinterpretation or incorrect calculations due to mismatched data types, ensuring smooth analysis.
7. Remove Duplicates
Duplicated data entries can skew your analysis by inflating totals or introducing inaccuracies. It’s important to identify and remove any duplicates.
- How to do it: Right-click the column where duplicates might exist, then select Remove Duplicates.
- Purpose: Removing duplicates ensures that each data entry is unique, resulting in accurate and reliable reports.
8. Trim and Clean Data
Text data often comes with leading or trailing spaces or non-printable characters. Cleaning this data ensures consistency.
- How to do it: Use Transform > Format > Trim to remove unnecessary spaces, and Clean to remove non-printable characters.
- Purpose: Trimming and cleaning text data ensures consistency and prevents potential errors when joining datasets or conducting analyses based on string matching.
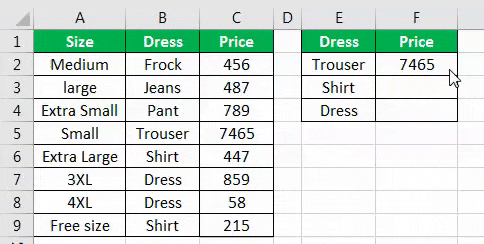
9. Split and Merge Columns
Sometimes, data is combined into one column and needs to be split (e.g., first and last names, date and time). Conversely, you may want to merge multiple columns into one (e.g., creating a full address from separate fields).
- How to do it:
- For splitting: Select the column, go to Transform > Split Column by delimiter (e.g., space, comma).
- For merging: Select multiple columns, right-click, and choose Merge Columns.
- Purpose: Splitting and merging columns helps you organize your dataset in a way that aligns with your analytical goals.
10. Apply and Load Data to Power BI
After completing the data cleaning, the final step is to apply your transformations and load the data back into Power BI.
- How to do it: Click Home > Close & Load. This will apply all transformations and load the clean data into Power BI for analysis.
- Purpose: This finalizes the cleaning process and makes your data ready for visualization, reporting, or further analysis in Power BI.
Conclusion
Cleaning data with Power Query is a vital part of any data analysis process in Power BI. These 10 steps will help ensure that your data is clean, reliable, and ready for actionable insights. By following this structured approach, you’ll minimize errors, streamline analysis, and set the foundation for building accurate and meaningful reports.