Mastering Microsoft 365 Copilot: Build AI Productivity with Intellisoft

Copilot Courses in Singapore at Intellisoft

Unlock the potential of Microsoft 365 with the Microsoft Copilot course in Singapore. This comprehensive Microsoft Copilot course is designed to enhance your productivity using AI tools that integrate seamlessly across Microsoft applications. Whether you are a novice or looking to deepen your understanding, this course will equip you with the skills to utilize Copilot effectively.

A large screen displays the Microsoft 365 Copilot logo.

Course Overview

The Microsoft Copilot course focuses on the capabilities of Microsoft 365 Copilot to streamline workflows. Participants will learn how to integrate AI tools into their daily tasks. Through hands-on experience, you will discover how Copilot can transform your productivity.

This course covers the functionality of tools like Excel and PowerPoint, showcasing how to automate repetitive tasks. By mastering these applications, you can leverage Microsoft 365 to achieve greater efficiency.

Course Objectives of Mastering Microsoft Copilot

The main objectives of the Copilot course are to provide a solid understanding of Microsoft Copilot’s features and to teach participants how to apply these features in real-world scenarios. You will learn to create prompts that enhance your productivity with generative AI. Additionally, the course aims to familiarize you with the AI-driven capabilities of Microsoft 365.

Participants will also explore the benefits of using Copilot in Office 365 and how it complements Microsoft Copilot. By the end of the course, you will be able to confidently navigate Microsoft 365 applications with AI support, and integrate Copilot in your work.

Course Schedule for Microsoft Copilot Courses

The Microsoft 365 Word Excel PowerPoint with Copilot course duration spans 3 days, with sessions designed to cover the three key Office Tools.  A shorter version of this course, from half a day to a full day or more can be customized for your organization too. Use Copilot to enhance your productivity at work.

This customized course option allows participants to learn based on their time available, while still benefiting from live sessions. Each module focuses on different aspects of Microsoft 365 Copilot, ensuring comprehensive coverage of all essential topics.

Whether you are participating in a shorter course, or a comprehensive course for mastering Microsoft Copilot, the course is structured to maximize learning. You will engage in practical exercises that reinforce your understanding of workflow automation.

If you wish to learn MS-4007 Course – Empower Your Workforce with Copilot for Microsoft 365 Use Cases, we offer this as a 1 day workshop – onsite and at our office too.

Prerequisites for Joining Microsoft Copilot 365 Courses

Microsoft 365 Word, Excel, PowerPoint with Copilot Training in Singapore at Intellisoft with WSQ & SkillsFuture

No prior experience with Microsoft 365 is necessary for this course; however, familiarity with basic computer skills will be beneficial. The course is designed to accommodate both beginners and advanced users looking to enhance your productivity through AI. A willingness to explore new technologies will significantly enrich your learning experience.

For those who aim to deepen their skills, additional resources for Microsoft co pilot will be provided. This includes access to Microsoft Learn and other e-learning platforms that complement the course material.

Intellisoft offers Digital Transformation with AI Tools courses

Join Intellisoft Systems 2 Day WSQ Funded course on Digital Transformation with AI Tools like ChatGPT, Gemini, Claude, FireFlies.ai, Canva, Audio AI Tools, Video AI Tools, Productivity AI Tools in Singapore. 

A separate Canva course with SkillsFuture and WSQ funding from SSG Singapore is available for Singaporeans and Permanent Residents with grants.

We also have a WSQ Approved Create Agentic AI Automations Without Coding course to create your own AI Automations. You can also explore Copilot Pro in and the power of Copilot Studio to create your own AI agents with Microsoft Tools.

Unlock the Power of Microsoft Copilot with Intellisoft Training

✅ Transform the Way You Work with AI

At Intellisoft, we bring you a series of hands-on, instructor-led Microsoft Copilot courses designed to help you harness the full power of AI across Microsoft 365 apps. Whether you’re a business user, a team leader, or part of an operations or HR team, these courses will show you how to work faster, think smarter, and get more done — all with the help of Copilot.

Our Copilot training suite includes:

  • MS-4007: Microsoft 365 Copilot User Enablement Specialist

  • Working Smarter with Copilot in Word, Excel & PowerPoint

Each course is designed using official Microsoft Learn materials and led by expert instructors to ensure practical, real-world learning that you can apply immediately in your workplace.

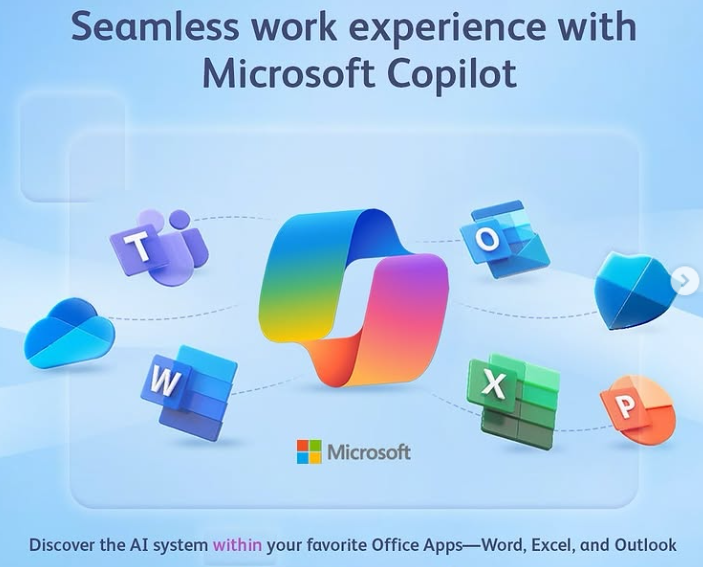
What is Microsoft Copilot?

Microsoft Copilot is your AI-powered assistant built right into Microsoft 365 apps like Word, Excel, PowerPoint, Outlook, and Teams. It uses large language models (LLMs), Microsoft Graph, and your content to help you draft, summarize, analyze, and automate tasks — all with natural language prompts.

Imagine:

  • Writing a full proposal or policy in Word with just a short prompt

  • Creating charts, insights, and forecasts in Excel without writing formulas

  • Generating entire presentations in PowerPoint from your meeting notes or a report

With Copilot, you’re not just working faster — you’re working smarter.

Courses We Offer

MS-4007: Microsoft 365 Copilot User Enablement Specialist

Learn to champion the adoption of Copilot in your organization. This course is ideal for team leads, change agents, and digital champions tasked with driving AI transformation at work. You’ll learn how to implement Microsoft’s user enablement framework, identify high-value Copilot scenarios, and support colleagues in their AI adoption journey.

Work Smarter with Copilot in Word, Excel & PowerPoint

This 1-day course gives you practical experience using Copilot directly in the three core apps:

  • Word: Draft content, rewrite text, create reports, and summarize meetings

  • Excel: Generate formulas, analyze trends, build dashboards and insights

  • PowerPoint: Instantly turn outlines into full slides, refine layouts, and add visual appeal

Perfect for professionals who use Office daily and want to supercharge their productivity with AI.

Free Trial of Microsoft Copilot for AI-Driven Productivity

A free trial of Microsoft Copilot is available to participants who want to try this new AI software in their own lives and workplace for content creation or improving efficiency and productivity. This 30 day free trial can be cancelled at any time, but does require a credit card to be keyed in initially.

Mode of Assessment

Assessment will take place through hands-on projects that allow you to demonstrate your understanding of the course content. You will work on real-world scenarios that require you to apply what you’ve learned about Copilot. Feedback will be provided to help you improve and refine your skills.

By the end of the course, participants will receive a certificate acknowledging their completion. This certification serves as a valuable addition to your professional portfolio, showcasing your proficiency in using Microsoft 365 Co-pilot.

Fees and Funding

The Copilot course is competitively priced to make it accessible to a wide audience. Various funding options are available to support learners in Singapore. You can inquire about potential subsidies and grants that may help cover course fees. Participants can also use their SkillsFuture Credits for the 3 day Microsoft Office with Copilot, and the Digital Transformation with AI Tools courses.

Investing in your skills through this course will open up new opportunities in your career. The knowledge acquired will not only enhance your productivity but also position you as a leader in digital transformation.

The ai course covers several artificial intelligence tools that can help in content creation for marketers, educators, business persons, executives, professionals and managers.

FAQ

What are the prerequisites for the Copilot course?

No prior experience is needed, but basic computer skills are recommended. This is a very practical and hands-on course, one of our best Microsoft copilot courses.

What is the course duration?

The course can be customized for your organization, based on the available time. Usually we do a 1 day course, and we also offer a WSQ funded Microsoft Word Excel PowerPoint with Copilot course which is for 3 full days.

Will I receive a certificate after completing the course?

Yes, a certificate will be awarded upon successful completion of the Microsoft Office course with 365 and Copilot. For corporate trainings on Copilot courses, we will provide a certificate of attendance also.

What is the mode of assessment for Mastering Microsoft Copilot?

Assessment includes hands-on projects based on real-world scenarios. If you opt for a customized corporate training  on Copilot Courses in Singapore without any WSQ Funding, then there is no requirement for any assessment, and we can completely skip it, to focus the entire time on Mastering Microsoft Copilot.

Are there funding options available?

Yes, there are various funding options to support learners. The WSQ Funding comes from SSG Singapore for the 3 day comprehensive course on Microsoft 365 with Copilot. It covers Copilot across Microsoft 365.

Do I need prior AI or technical knowledge to attend these courses?

No. These courses are designed for everyday Microsoft 365 users. If you’re comfortable using Word, Excel, or PowerPoint, you’re ready for Copilot training.

Is Copilot already included in Microsoft 365?

No. Copilot is a premium add-on to Microsoft 365 and must be purchased by your organization. You will need a Copilot-enabled account to practice during the course.

Will I get hands-on experience with Copilot?

Yes! All our sessions are interactive, with guided labs, exercises, and real-world examples using your Copilot-enabled Microsoft 365 apps.

What’s the difference between MS-4007 and the Word/Excel/PowerPoint with Co Pilot course?

The Microsoft MS-4007 focuses on enabling teams to adopt Copilot across organizations. The Word/Excel/PowerPoint course is more about hands-on productivity techniques for individual users.

CONTACT INTELLISOFT for COPILOT COURSES IN SINGAPORE

Call us at +65-6252-5033 or email to training@intellisoft.com.sg with your training requirements. Alternatively, you can fill our Enquiry Form, and tell us what exactly do you need. We will get back to you within 1 business day.


Why Learn Python For Data Analysis: An Eye Opener

Learn Python for Data Analysis at Intellisoft Singapore

Python Popularity

Python is best programming language to learn at Intellisoft Training with WSQ Funding

Wondering Why Learn Python?

The workplace has already changed. As technology continues to rapidly transform industries & jobs, staying relevant & competitive requires continuously updating, diversifying, and building completely new skill sets.

Today, Data analysis is no longer the job of IT folks. Everyone is required to analyze the past, adapt to change, and forecast the future. The ability to do so well is increasingly what will keep your job.

Learn Python & Stay Relevant

Python is a great programming language for data science and general data analysis. It is open-source & free to download for anyone, unlike commercial tools like SAS or SPSS. Find out why you must learn Python for your current & future jobs.

Purpose of Learning Python

It is suitable for almost any data science task, from data manipulation and automation to ad-hoc analysis and exploring datasets.

Python is easy to learn, even for complete beginners. You don’t need a background in IT or computer science.

Python Training in Singapore is available for you to get started asap.

Who Uses Python & Why You Should Learn it?

Python is used by people that want to go deeper into data analysis or apply statistical techniques, and by most people who turn to data science.

Python is a production-ready language, meaning it has the capacity to be a single tool that integrates with every part of your workflow!

Why Learn Python Programming
Why You Must Learn Python Programming To Stay Ahead

Why Learn Python: It’s Usability is Great

Whether you work in Manufacturing, Services, Banking, Finance, Logistics, Telecom, Marine, Oil & Gas, Shipping, IT or any other industry, you’ll be able to apply Python to everyday work. And people with a software or engineering background may find Python comes more naturally to them.

  • Coding and debugging is way easier than other programming languages because of the simple syntax of Python
  • Python has a robust ecosystem and is commonly considered one of the easier programming languages to read and learn. Its programming syntax is simple and its commands mimic the English language.
  • Python code is syntactically clear and elegant, easily interpretable, and easy to type.
  • It’s great for building data science pipelines and machine learning products integrated with web frameworks at scale.

Why Learn Python: It’s a Flexible Language

Python is flexible for creating something that has never been done before.

You can also use it for scripting websites, Clean or Scrape Web Data, Merge data from multiple sources, and create games & other applications easily.

Why Learn Python: It is Extremely Easy To Learn

Python’s focus on readability and simplicity means its learning curve is relatively linear and smooth. With this, you can see the difference as you begin to learn Python. Once you know the basics of Python, you should go for Python For Data Analysis Training in Singapore

Python is considered a good language for beginners. No wonder it is the Number 1 Programming language in the world.

Python Programming Training Singapore

Advantages of Python Over Other Languages

  1. General-purpose programming languages are useful beyond just data analysis.
  2. Python has gained popularity for its code readability, speed, and many other functionalities too.
  3. It is great for mathematical computation & learning how algorithms work.
  4. Python has high ease of deployment and reproducibility.

Popular Libraries and Packages

  • pandas to easily manipulate data
  • SciPy and NumPy for scientific computing
  • Scikit-learn for machine learning
  • Matplotlib and seaborn to make graphics & charts
  • statsmodels to explore data, estimate statistical models, and perform statistical tests and unit tests

Getting Started in Python

There are many Python IDEs to choose from which drastically reduce the overhead of organizing code, output, and notes files.

Jupyter Notebooks and Spyder are 2 such popular IDE that we use to teach Python at Intellisoft.

Learn Python Step-By-Step: Instructor Led Training

The best approach to get initiated with using Python is to go for our Step by Step, Beginner Course to introduce the Python Language to you.

With an experienced and knowledgeable instructor, you can learn faster. Our fantastic trainers are ready to explain simple to complex topics with ease. It will be a much better experience.

Plus, attending training will significantly reduce the learning curve, and you will thank yourself for having a quick and rapid start to learning the world’s most popular language – Python.

Contact Us for our Python Training Programs.

Call +65-6250-3575 or email training@intellisoft.com.sg for a Python course brochure.

Article Written By: Vinai Prakash, Intellisoft Systems

Learn More About Python Training in Singapore

Want to explore more about Python? Check out these helpful articles:

Data Model Creation and Considerations in Power BI

How To Do Data Modeling in Power BI - Learn at Intellisoft Training Power BI Course by Vinai Prakash

How To Do Data Modeling in Power BI - Learn at Intellisoft Training Power BI Course by Vinai PrakashData is at the heart of business intelligence and analytics.

Data Modeling in Power BI - Dimension

Microsoft Power BI is a powerful tool that empowers users to transform raw data into valuable insights.

At the core of business intelligence lies the creation of a robust data model.

In this article, we will explore the essential aspects of data model creation in Power BI and the considerations that should be kept in mind as you build, and use your data model for data analysis and visualization.

Understanding Data Models

A data model in Power BI is a structured representation of data that enables efficient analysis and visualization.

It serves as the foundation for all your reports and dashboards, ensuring that the data is organized and easy to work with.

Without a well-designed data model, you may find it challenging to derive meaningful insights from your data.

In Power BI, we can create a data model based on

  • Star Schema Modeling Techniques
  • Dimensional Data Modeling 
  • Snowflake Data Modeling

Types of Tables in Data Models

Types of Tables in Power BI - Fact & Dimension Tables & Their Properties

Types of Tables in Power BI – Fact & Dimension Tables & Their Properties

1. MASTER Tables

MASTER tables are the foundational building blocks of your data model. They are characterized by their slow growth over time, making them ideal for storing reference data such as Customer, Products, Country, Business Units, Cost Centers, Calendars and Categories.

Key features of MASTER tables include:

  1. Slow Growth: MASTER tables typically evolve slowly over time, with additions of new data occurring infrequently.
  2. Flexibility: You can easily add extra columns to MASTER tables to accommodate new attributes or information. The more columns, the more ways you can “slice and dice” the data!
  3. Fewer Rows: These tables tend to have fewer rows, often referred to as “short” tables.
  4. “FAT” but Short: MASTER tables may have many columns, making them “FAT” in terms of width but short in terms of height (number of rows). Thus, we don’t hesitate to add new columns as needed, as “Calculated Columns” using DAX (Data Analysis EXpressions in Power BI)
  5. Naming Convention: To distinguish them from other table types, MASTER tables should be named with a prefix, like “d.”, which denotes that this table is a DIMENSION table.

2. TRANSACTION Tables

TRANSACTION tables are designed to capture data that changes rapidly and involves high transactional volumes.

Examples of TRANSACTION tables include Sales, Purchase Orders, Accounting Entries, Call Centre Calls, and Service Tickets.

Key features of TRANSACTION tables include:

  1. Rapid Growth: TRANSACTION tables grow quickly over time, recording numerous data entries.
  2. Limited Flexibility: Adding extra columns to TRANSACTION tables can be costly in terms of increasing table size and impacting query efficiency.
  3. More Rows: These tables contain a substantial number of rows, often referred to as “tall” tables.
  4. “THIN” but Tall: TRANSACTION tables typically have fewer columns, making them “THIN” in terms of width but tall in terms of height.
  5. Naming Convention: To distinguish them from other table types, TRANSACTION tables should be named with a prefix “f.“, to denote a FACT table.

Power BI Modeling & Dashboard Creation Training in Singapore at Intellisoft Systems

Dimension and Fact Tables

In the context of data modeling in Power BI, Dimension and Fact tables play distinct roles. Dimension tables are typically associated with MASTER tables, serving as a reference for attributes you want to analyze. Fact tables, on the other hand, relate to TRANSACTION tables, capturing the core data you want to measure and analyze.

Determining Your Analysis Requirements

Before you dive into data model creation, it’s crucial to identify your analysis needs. Determine the specific data elements you want to analyze.

For example, if you aim to analyze sales by year, by country, by division, and by category, you should identify “sales” as your Fact table and “year,” “country,” “division,” and “category” as your Dimension tables.

Similarly, to analyze expenses by department by country by geography, and by year, quarter or month, the “Expenses” will be the Transactions (Fact Table), and the “geography”, “country”, “department”, “year”, “quarter”, “month” will be the dimensions to slice and dice the expenses.

Building the Data Model in Power BI

Creating a data model in Power BI involves several key steps.

Start by importing data from various sources, such as databases, spreadsheets, or online services. There are hundreds of sources that can be loaded into Power BI. CSV, Text, PDF, multiple files from a single folder can all be loaded easily.

For how to load such data, join our Power BI Course in Singapore.

Next, define relationships between tables, specifying how they are connected in the Model View in Power BI.

Arrange the tables in a Star Schema fashion. Another way is to keep the master tables on the top, and the Transaction table at the bottom. This way, you can “look up” the values for any transaction from the Dimension tables above.

Data Model in Power BI Training Class in Singapore by Intellisoft Master Trainer Vinai Prakash
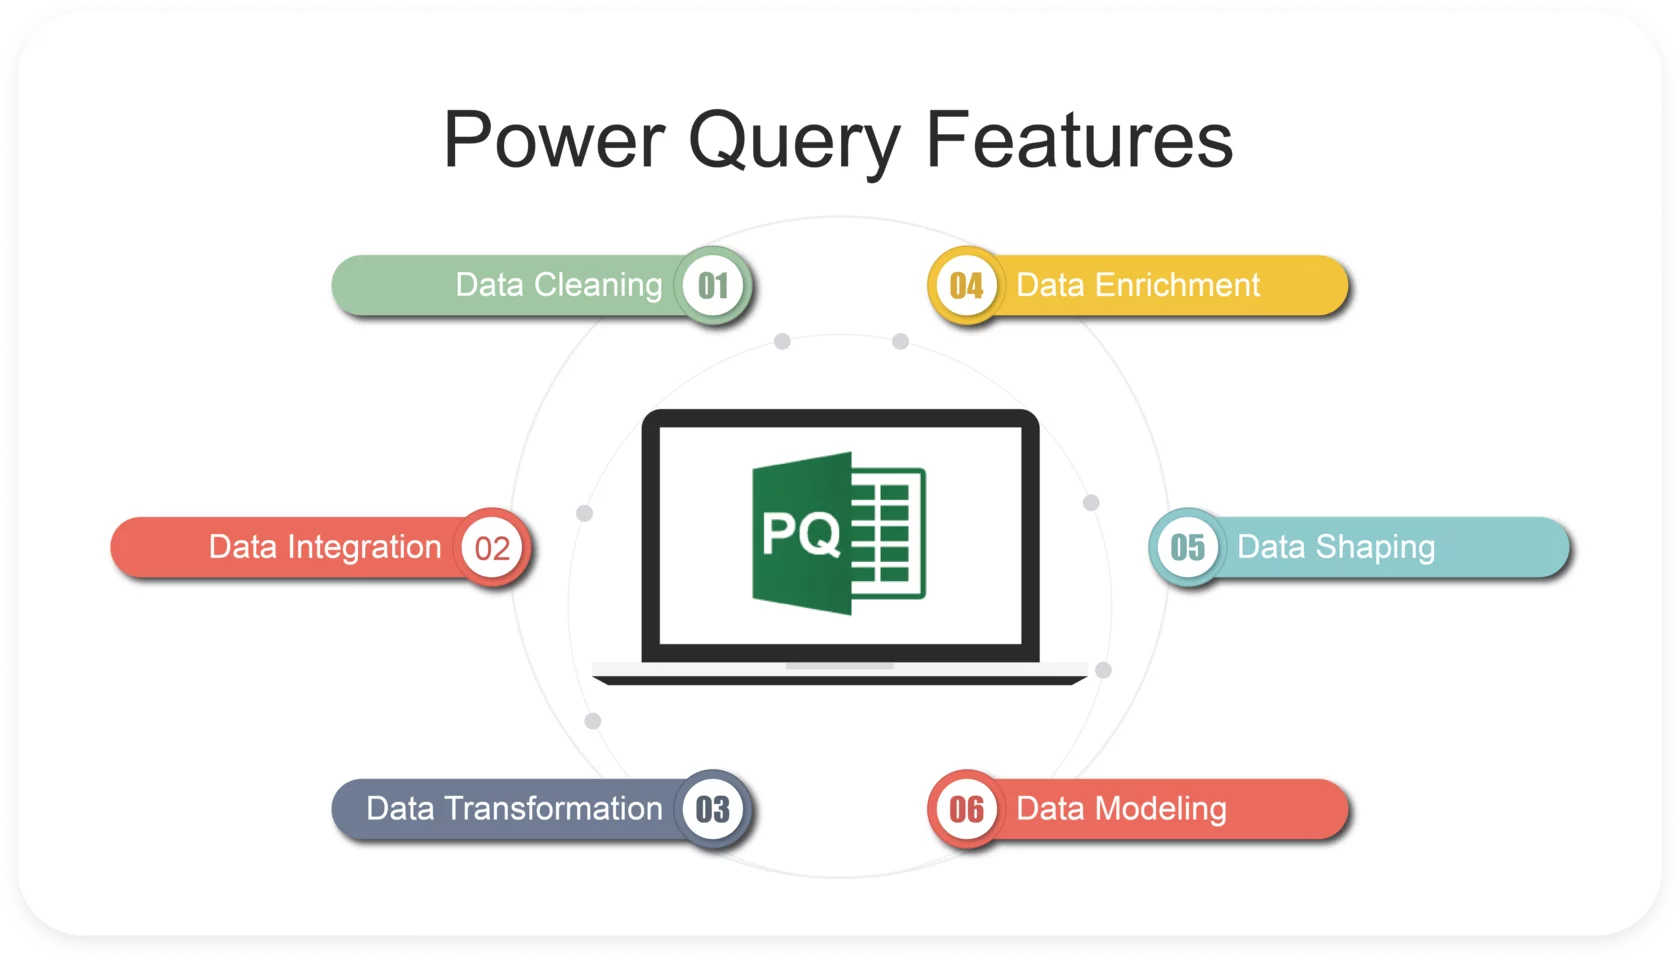
Finally, structure your data to ensure it is ready for analysis.

Best Practices for Building the Data Model:

  • Choose the Right Data Sources: Select data sources that are relevant to your analysis and ensure they are structured in a way that is conducive to modeling.
  • Normalize Data: Normalize your data model to reduce redundancy. This means avoiding duplication of data and creating relationships between tables.
  • Understand Data Types: Be aware of the data types used in your model to optimize performance and avoid compatibility issues.
  • Define Hierarchies: Create hierarchies within Dimension tables to allow for more flexible and intuitive drilling down into data.
  • Use Calculated Columns and Measures: Instead of adding unnecessary columns to Fact tables, leverage calculated columns in Dimensions, and measures in Fact tables to perform calculations as needed.

Relationship Management

Establishing and managing relationships between tables is crucial for successful data modeling. Power BI’s intuitive interface makes it easy to define these relationships, which help in connecting data from different tables to answer complex questions.

In Power BI, relationships between Fact and Dimension tables are essential for combining and analyzing data from multiple sources. These relationships come in different cardinality types:

  1. one-to-one (1:1),
  2. one-to-many (1:M), and
  3. many-to-many (M:M).

Let’s explore each of these relationship types:

  1. One-to-One (1:1) Relationship:
    • In a one-to-one relationship, each row in one table corresponds to exactly one row in another table.
    • This relationship is used when you have tables that share a common field, and the relationship between them is unique and direct.
    • One-to-one relationships are not very common in Power BI but can be useful in specific scenarios, such as when you have a customer table and an address table, and each customer has only one unique address.

    Example: A “Person” table with a unique “Employee ID” linked to an “Employee Details” table with one record per employee.

  2. One-to-Many (1:M) Relationship:
    • In a one-to-many relationship, each row in one table can relate to multiple rows in another table, but each row in the second table is related to only one row in the first table.
    • This relationship is the most common in Power BI, as it represents a parent-child relationship, where one table contains the unique values (parent) and another table contains related values (child).
    • One-to-many relationships are used for scenarios where you have one primary table and related information in a secondary table.

    Example: A “Customer” table with unique customer IDs related to a “Sales” table with multiple sales records for each customer.

  3. Many-to-Many (M:M) Relationship:
    • In a many-to-many relationship, multiple rows in one table can relate to multiple rows in another table, and vice versa.
    • Many-to-many relationships are less common and usually require an intermediate table to resolve them. This intermediate table is often referred to as a “bridge” or “junction” table.
    • This relationship type is used when you have situations where multiple values in one table can be related to multiple values in another table, and you need to establish these connections.

    Example: An “Orders” table related to a “Products” table through an “OrderDetails” bridge table, as each order can contain multiple products, and each product can be a part of multiple orders.

    Another example is where an author can have many books authored, and each book can be authored by one or many authors.

Best Practices for Relationship Management:

Understand Cardinality: Cardinality defines the relationship between tables, including one-to-one, one-to-many, or many-to-many. Ensure that the cardinality matches your data structure.

Use Bi-Directional Filters Sparingly: Bi-directional filters can be useful, but they should be used with caution to avoid unintended consequences.

Create DAX Measures: Use Data Analysis Expressions (DAX) measures to create calculations that span multiple tables, enhancing the depth of your analysis.

DAX Measures are the new name for Formulas in Power BI. They calculate the value in the formula in-memory, without taking up any additional space in the data file. Thus, the data file stays small, and the in-memory calculations can be performed quite fast.

A Power BI file is like a Zip file, compressing the data at least 10 times or more in most cases. The extension of Power BI files is .pbix.

Data Model Considerations for Scalability

As your data volume grows, it’s essential to consider the scalability of your data model. Techniques such as data compression, partitioning, and aggregations can be employed to handle larger datasets while maintaining model performance.

Best Practices for Scalability:

  • Data Compression: Implement data compression techniques to reduce the size of your model, which will lead to faster query performance.
  • Partitioning: Use data partitioning to manage large datasets more efficiently, making it easier to work with historical or archived data.
  • Aggregations: Create aggregations to pre-calculate summary data, allowing for quicker responses to user queries while dealing with vast datasets.

Conclusion:

In conclusion, data model creation is a fundamental step in Power BI that can significantly impact the quality of your data analysis and reporting.

By understanding the types of tables, defining your analysis requirements, and following best practices, you can build effective data models that lead to valuable insights and informed decision-making.

Mastering the art of data modeling is essential for anyone looking to harness the full potential of Power BI’s capabilities. With careful consideration of scalability, relationships, and best practices, you can ensure that your data model remains efficient and effective as your data and reporting needs grow.

To Learn more about Data Modeling in Power BI, join our Power BI MasterClass in Singapore here. It is conducted by our Founder & Master Trainer, Mr. Vinai Prakash.

Article Written by Vinai Prakash, MBA, PMP, GAP, ACTA Certified, EXCEL & Power BI Enthusiast!

Additional Resources for Power BI

Training Courses

Data Analytics & Visualization with Power BI

Learn Microsoft Power BI Suite For Better Data Analysis & Reporting

Power BI Tips, Tricks & Video Tutorials

Power BI Tip #2: Reference Query Results in Another Query With Power Query [Video Tutorial]

Microsoft Power BI: Super Charge Your Data Analysis Process

Power BI Tip #6: Fixing The Vertical Axis in Power BI Visualisations

Power BI Tip #5: All About Slicer Controls in Power BI

Power BI Tip#4: Enter Data Into Power BI Quickly [Video]

Power BI Tip #3: Quick Formatting of Power BI Visuals

How To Clean Data Using Power Query

Power Query To Clean Data in Power BI and Excel

Data cleaning is one of the most critical steps in any data analysis process. Without clean, structured, and reliable data, insights drawn from analysis can be inaccurate or misleading.

In Power BI, Power Query serves as a powerful tool that allows users to connect, transform, and clean data efficiently, ensuring that it’s ready for reporting and analysis.

Whether you’re working with messy datasets from multiple sources, dealing with missing values, or eliminating duplicates, Power Query provides a simple, yet robust interface to clean data with minimal coding.Power Query To Clean Data in Power BI and Excel

In this guide, we’ll walk through a 10-step process to clean data using Power Query, providing clear and actionable instructions to ensure your data is refined and ready for analysis.

10-Step Process to Clean Data Using Power Query in Power BI

  1. Load Data into Power Query
  2. Remove Unnecessary Columns
  3. Rename Columns
  4. Filter Out Unwanted Rows
  5. Handle Missing Values
  6. Change Data Types
  7. Remove Duplicates
  8. Trim and Clean Data
  9. Split and Merge Columns
  10. Apply and Load Data to Power BI

Step-by-Step Process & Details on How to Use Power Query in Excel / Power BI

1. Load Data into Power Query

The first step is importing your data into Power Query. This could be from an Excel file, SQL database, or other data sources.

  • How to do it: In Power BI, click on Home > Get Data. Choose your data source and load the data into Power BI. Then click Transform Data to open Power Query Editor.
  • Purpose: This step allows you to connect Power BI to your data source, bringing raw data into the environment for cleaning and transformation.

2. Remove Unnecessary Columns

Not all columns in your dataset are needed for analysis. Removing irrelevant columns helps streamline the dataset and improve performance.

  • How to do it: Select the columns you don’t need, right-click, and choose Remove Columns.
  • Purpose: This reduces the size of your dataset, making it easier to work with and removing noise that could affect analysis.

3. Rename Columns

Renaming columns improves readability and makes your dataset more understandable, especially when working with multiple datasets or sharing reports with others.

  • How to do it: Right-click the column header and choose Rename. Alternatively, double-click the column name to rename it.
  • Purpose: Clean, descriptive column names make it easier to recognize and use data fields in future transformations and analysis.

4. Filter Out Unwanted Rows

Filtering data ensures that only the relevant rows are kept for analysis. This is particularly useful when you have data entries like errors or outliers that can skew your results.

  • How to do it: Click the dropdown arrow in the column header and apply filters based on conditions (e.g., removing rows with zero values, errors, or irrelevant categories).
  • Purpose: Filtering reduces dataset size and removes irrelevant data, focusing on what’s important for your analysis.

5. Handle Missing Values

Data often has missing values, which can create issues in analysis. You can either remove rows with missing data or fill in values where appropriate.Use Power Query to Clean Data in Power BI. Join Hands on Training at Intellisoft Singapore

  • How to do it: Right-click the column and select Replace Values to fill missing data, or use Remove Rows > Remove Blank Rows to eliminate incomplete records.
  • Purpose: This ensures your dataset is complete or that missing data is handled in a way that doesn’t negatively impact your analysis.

6. Change Data Types

Correctly assigning data types (e.g., text, number, date) is crucial to ensure that Power BI interprets your data correctly.

  • How to do it: Select the column, then go to the ribbon, click on the Data Type dropdown, and choose the appropriate type (e.g., Decimal Number, Date, Text).
  • Purpose: This avoids issues like date misinterpretation or incorrect calculations due to mismatched data types, ensuring smooth analysis.

7. Remove Duplicates

Duplicated data entries can skew your analysis by inflating totals or introducing inaccuracies. It’s important to identify and remove any duplicates.

  • How to do it: Right-click the column where duplicates might exist, then select Remove Duplicates.
  • Purpose: Removing duplicates ensures that each data entry is unique, resulting in accurate and reliable reports.

8. Trim and Clean Data

Text data often comes with leading or trailing spaces or non-printable characters. Cleaning this data ensures consistency.

  • How to do it: Use Transform > Format > Trim to remove unnecessary spaces, and Clean to remove non-printable characters.
  • Purpose: Trimming and cleaning text data ensures consistency and prevents potential errors when joining datasets or conducting analyses based on string matching.

9. Split and Merge Columns

Sometimes, data is combined into one column and needs to be split (e.g., first and last names, date and time). Conversely, you may want to merge multiple columns into one (e.g., creating a full address from separate fields).

  • How to do it:
    • For splitting: Select the column, go to Transform > Split Column by delimiter (e.g., space, comma).
    • For merging: Select multiple columns, right-click, and choose Merge Columns.
  • Purpose: Splitting and merging columns helps you organize your dataset in a way that aligns with your analytical goals.

10. Apply and Load Data to Power BI

After completing the data cleaning, the final step is to apply your transformations and load the data back into Power BI.

  • How to do it: Click Home > Close & Load. This will apply all transformations and load the clean data into Power BI for analysis.
  • Purpose: This finalizes the cleaning process and makes your data ready for visualization, reporting, or further analysis in Power BI.

Conclusion

Cleaning data with Power Query is a vital part of any data analysis process in Power BI. These 10 steps will help ensure that your data is clean, reliable, and ready for actionable insights. By following this structured approach, you’ll minimize errors, streamline analysis, and set the foundation for building accurate and meaningful reports.


Top 10 DAX Expressions in Power BI

Top 10 Functions in Power BI DAX

Top 10 DAX Expressions in Power BI

As a Power BI trainer at Intellisoft Systems, and writer of several Excel & Power BI articles, I’ve worked with with over 15,000 business professionals, data analysts, and executives over the years.

When people first approach Power BI, they often marvel at how it brings their data to life with interactive dashboards and visualizations.

But as they dive deeper, they soon realize that Power BI’s true power lies not just in its visuals, but in its ability to manipulate, analyze, and derive insights from data using DAX (Data Analysis Expressions).

Most Important DAX Functions in Power BI

My Journey with DAX in Power BI

I remember my own journey into the world of DAX, which felt a lot like learning a new programming language. At first, the syntax was daunting, and it seemed like every time I thought I understood how a function worked, a new scenario would throw me off.

However, as I started teaching Power BI Courses around the world in our public classes at Intellisoft, and as I assisted hundreds of data analysts in creating their Business Intelligence Dashboards in Power BI, I noticed a pattern.

The same set of DAX expressions came up repeatedly as crucial for solving business problems, answering analytical questions, or building complex reports.

The beauty of DAX is that, once you grasp the core concepts, it opens up endless possibilities for data transformation and modeling. It’s not just about creating formulas—DAX helps you enhance your reports by extracting hidden patterns and making data-driven decisions easier.

With Power Query to Clean the Data, and DAX to enhance the analysis of data, it is the best of both worlds.

Why Create DAX Expressions?

In the world of data analytics, basic reports often don’t tell the full story. As professionals, we are expected to go beyond the surface-level numbers and reveal patterns & insights that drive business strategy.
DAX Functions in Power BI
Here’s why DAX expressions play such an essential role in this:

  1. Advanced Calculations: DAX allows you to perform calculations that Excel or standard report-building tools can’t easily handle. Whether it’s aggregating data across different periods, creating year-over-year growth metrics, or applying conditional logic, DAX gives you that edge.
  2. Data Relationships: Power BI thrives on relationships between datasets. DAX lets you define those relationships more clearly, ensuring that your reports reflect the real connections within your data.
  3. Custom Metrics: Every business has unique key performance indicators (KPIs) and metrics. DAX allows you to create custom measures that align with your organization’s needs, ensuring your reports are tailored to the business context.
  4. Dynamic Reporting: DAX enables dynamic filtering and context-driven calculations. This allows you to create reports that respond in real-time to user inputs, making your dashboards far more interactive and meaningful.
  5. Enhanced Performance: While Power BI’s drag-and-drop interface makes it easy to start, large datasets or complex models can slow things down. Writing efficient DAX expressions can optimize your data models, improve performance, and ensure that your reports scale with your data.

Top 10 Most Useful DAX Expressions in Power BI

Over the years, I’ve seen which DAX expressions are most commonly used and how they help professionals derive actionable insights. Here are the top 10 DAX expressions that every serious data analyst, executive, or manager should know:

  1. CALCULATE()
    The most versatile DAX function. It lets you modify the context in which a calculation is performed. Use it to create measures that behave differently based on filters.Example:
    CALCULATE([Total Sales], 'Calendar'[Year] = 2023)
  2. SUMX()
    A powerful iteration function. SUMX allows you to perform row-by-row calculations across tables. It’s essential for scenarios where you need to evaluate expressions in each row before summing the result.Example:
    SUMX(Sales, Sales[Quantity] * Sales[Price])
  3. FILTER()
    Used to return a table of data based on a filter expression. It’s particularly useful when working with complex conditions that you can’t handle with basic filtering.Example:
    FILTER(Sales, Sales[Region] = "East" && Sales[Amount] > 10000)
  4. RELATED()
    This function retrieves related data from another table. It’s handy when you have a relationship between tables and need to pull in values from related tables.

    Example:

    RELATED(Products[Category])
  5. DIVIDE()
    A safer way to perform division, it handles cases where division by zero would otherwise cause an error. It’s more reliable than the simple “/” operator.Example:
    DIVIDE([Total Sales], [Total Units], 0)
  6. ALL()
    Removes any filters that may be applied to a column or table. This is useful when you need a calculation that ignores certain filters, such as when calculating overall totals.Example:
    CALCULATE([Total Sales], ALL(Sales[Region]))
  7. RANKX()
    Allows you to rank items based on a specified expression. It’s invaluable for comparing performance, such as ranking sales by regions or products.Example:
    RANKX(ALL(Sales[Region]), [Total Sales])
  8. EARLIER()
    Often used in calculated columns, EARLIER enables row-by-row context in calculations where you need to refer to previous row contexts.Example:
    CALCULATE(SUM(Sales[Amount]), FILTER(Sales, Sales[Product] = EARLIER(Sales[Product])))
  9. SWITCH()
    Functions like a multi-conditional IF statement, allowing you to return different values based on specific criteria.Example:
    SWITCH([Rating], 1, "Poor", 2, "Average", 3, "Good", "No Rating")
  10. DATESYTD()
    A time intelligence function that calculates the year-to-date total of a measure. It’s essential for tracking cumulative performance over time.Example:
    DATESYTD('Calendar'[Date])

Microsoft is adding new DAX functions almost every month. There are already over 800+ DAX functions, whereas in Excel there are only about 400+ functions. Whatever calculation you are planning to build, there is most likely a DAX function that can be used to simplify the expression. It is worth learning new DAX functions and reviewing the entire function list to checkout the functions you can use immediately.

Conclusion

Mastering DAX is a continuous learning journey. It can seem overwhelming at first, but once you understand its logic and structure, you’ll realize how powerful it is in creating actionable insights and making sense of complex data.

In my Power BI classes, I always encourage participants to experiment with these expressions, building them into their regular reporting process. Once you start using DAX effectively, you’ll wonder how you ever managed without it.

Creating DAX expressions in Power BI allows you to push your data analysis skills to new heights. Whether you’re an analyst diving deep into data trends, or a manager looking for quick, actionable insights, these top DAX functions will empower you to extract the maximum value from your data models.

Power BI MasterClass in Singapore at Intellisoft Systems

How To Write An Effective Email

Learn to Write Effective Emails at Intellisoft Singapore

Most business communication happens via email with virtual offices, global clients, and multiple time zones. Yet, most people struggle to write great, effective and professional emails.

The result:  People judge you by your emails. If the email seems unprofessional or buggy with mistakes, your and the company’s reputation is immediately tarnished.

Fortunately, writing compelling and professional emails within a few minutes is extremely easy. Just remember to take note of the following tips.

1.  Subject lines: Always use a simple, to-the-point subject line. Ideally, it should be no longer than 5-7 words. Most people look at the subject line to decide if they are going to open, and read the email, or simply delete it, irrespective of the content.

2. Greet: Always provide a simple greeting at the beginning of the email. It could simply be Hi Susan, or Hello Richard.

3. Thank for something: If this is a follow-up email on something, or you are replying to someone’s email, it is a good idea to thank the person for replying to you. Thanks a lot for getting back to me so quickly. Thanks for your time on the phone, or Thanks for the meeting. By thanking the person, you make it a more pleasant email, and the recipient is put at ease with your nice comments.

4. Reason / Objective of Email: The key reason for writing the email should be very clear and concise. There is no need to write long-winded emails, as no one has time to read that much. People nowadays scan emails to quickly find the most important thing, and then decide what to do with it. You should quickly come to the point, like

We need to meet for a short while to discuss and resolve xyz, or
I need your help to review xyz, or I am writing with regards to xyz.

5. What you Want them to do / Ask: People scan emails to find out if they have to do anything about it – keep it, file it for the future, or take any action.  If you want them to do something for you, you must state it clearly. If this is not clear, then they won’t do anything. Keep it short, simple and easily scanable. For example,

  • I want you to arrange a meeting between the 3 parties – possibly by the 15th of the month.
  • I would appreciate it if you could review the attached proposal and get back to me by the 15th Nov.
  • Could you please reply which time suits you better – Monday at 11am or Tuesday at 4pm? 

By putting an action, and an action by date, you clarify what the recipient has to do, and by when. There is no room for ambiguity, and you are more likely to get what you wanted, by the due date.

6. Add Closing Remarks: It is a good idea for you to thank the recipient one more time, and add some nice, polite closing remarks, like:

  • Thanks for your help and support.
  • Thanks for your cooperation and support.
  • Feel free to contact me if you have any questions or concerns.  I look forward to hearing from you.

7. Signature: It is a must to have a simple yet clear signature. You should not end with Cheers or See Ya unless it is a friend you are writing to. For business writing, you must always say, With Best Regards, or Sincerely, or Thank You. Regards, Richard.

8. Spell Check & Grammar Check: It is essential to always do a spelling check and a grammar check. Nothing spoils a good email than a few typos. All good email packages have a built in spell check. You should make use of it, and even set your email configuration to always do a spell check before sending. This can make your emails more professional and set up you in the eyes of the recipient.

Common Pitfalls in Writing Professional Emails & How To Avoid Them:

  • Writing in All Capital Letters: Writing in all caps is considered offensive, rude on the internet. You should write Subjects in Title Case to stand out. The email body should be using normal English language rules – first letter is in capital, and the rest in small case. Use appropriate punctuation, and avoid using too many exclamation marks or question marks etc. It looks quite amateurish.
  • Using Vague Subject lines: Do not try to fool the recipient to click your email by sending suspicious email subject lines or shady ones. Click for BONUS, or Find the Good Stuff <<<-CLICK HERE, or SEE WHAT JOHNNY DOES TO GET THE PASSES are quite spammy, and should be avoided.
  • Attaching a huge image or attachment: Don’t attach huge files as attachments unless really required. You can always upload the file to some server or drobox etc. and provide them with the link to download if they wish to. This way you won’t become their enemy for jamming their mailbox with huge emails.
  • Not Using Professional language: While you could use the English language to the fullest, and use big words, it is not always recommended. You should write emails as if a high school kid is going to read it. Most people’s vocabulary is not huge, and they don’t read much books or learn new things beyond school years. Some experts go so far to say that you should stick to a Primary 6th grade English to be perfectly clear to everyone.
  • Not Using Formatting, Paragraphs, Headings: Do space out your emails with paragraphs, and points, or headings. Don’t write in huge block paragraphs of 8 to 10 lines or more in each block. It becomes pretty difficult to read, and you can lose a lot of people from getting your message. Use bold or underlined text in some important areas to make them stand out, but don’t bold every thing.
  • Lengthy emails That Are Not To the Point: Write only as much as you need. Don’t start a long winded email that goes on and on. We are writing an email, not a sales page.
  • Use of Emoticons: For processional emails, it is not recommended to use any emoticons. So don’t try to act cute on business emails. Stay to the point, clear, and professional as possible.

Related Training:

Learn the Art of Professional Business Email Writing & Email Etiquette in our 2 day WSQ Funded workshop.

Full of exercises and practical examples, it is a totally immersive workshop that will work wonders to your email writing skills. Do check it out here: Writing Professional Emails

Free Tips, Tutorials & Training Grants Info

Learn from expert tips, tricks and resources for Excel, PowerPoint, Photoshop, Python, Power BI, Project Management, IT, Soft Skills & more with our Email Newsletter.
Plus get the latest news on Grants. Join Today!

Found What You Were
Looking For?

Just Tell us...

We're Here To Help You!