Are You Microsoft Office Proficient?

Microsoft Office Training in Singapore

Every job seeker would have this word written in their resume Microsoft Office Proficiency.  

What Exactly is Microsoft Office Proficiency?

A Microsoft Office Proficient should be able to create an error-free, beautifully formatted document with header, footer, page number & Page breaks.

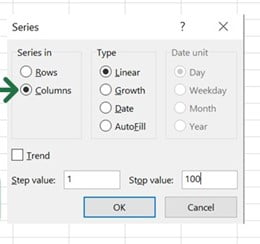
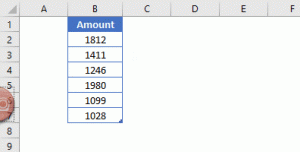
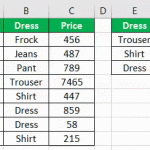
In Excel, they should be able to handle a large volume of data, format, sort, filter and create Pivot Tables for better visualization of Data.

In PowerPoint, the ability to make aesthetically appealing stellar presentation with graphics, images, GIFs, Animation is considered good proficiency.

Handling Microsoft Outlook like a pro to manage emails, create separate folders, track tasks, manage calendar, set reminder, marking them complete, and most important, getting things done quickly with these productivity tools.

This should not be overwhelming. It should be easy to do, and management expects everyone to be proficient in Microsoft Office.

It has been years since the Microsoft Skills have become mandatory for every person coming into the workforce – whether administration, data handling, HR or even the Managerial Position.

A research by IDC concludes that Microsoft Office is one of the top three skills desired by any employers next to oral and written communication Skills.

Possessing Microsoft Skills not only merely helpful in typing docs and tabulating number, rather they help us to get more productive, efficient and handle and present data professionally effectively than ever. Microsoft Office is the most effective, accessible, and easy to use software’s.

Lear Microsoft Office Skills at Intellisoft

Microsoft Word:

It has been used by many people as just a notepad or a typing software’s. But in real, it can do wonders in creating professional Documents.

If we can spend some time in learning a bit more than what the Home Tab has, it can considerably reduce the time we spend on making documents.

Word is useful to create better Proposals, Reports, Agenda, Meeting Minutes & more.
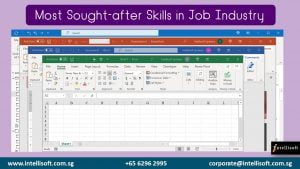
Microsoft Excel:

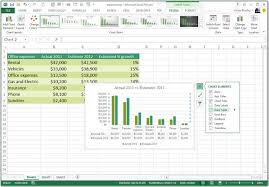
Excel is often used in accounting and finance for its ability to calculate and compute complex numbers. Even non-financial businesses use Excel because of its unbeatable ability to organize data in tables & for updating, organizing, and displaying the data nicely.

It is highly used in administration and managerial level to analyze data quickly and present to management.

It even supports Visual Basic Applications to create macros to automate functions that increase efficiency.

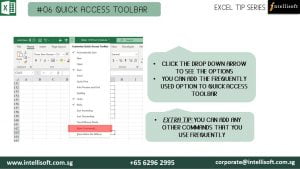
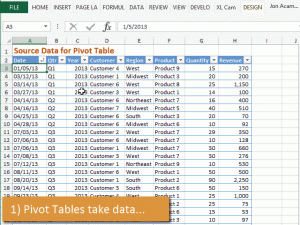
In fact, the Pivot Tables and Dashboards are inevitable when it comes to analysis and reporting. You must up your proficiency in Excel to master these functions.

Microsoft PowerPoint:

Everyone would have made a basic presentation in Schools and workplaces to present the work. But PowerPoint comes handy to make it visually appealing and effective.

Its intelligence in generating different design ideas for the slides is becoming so popular nowadays. Other than just suggestion, it allows you to use the plenty of shapes and icons that are in-built and even allows you to import illustrations and graphics from the internet while working.

In short, anyone can make a stellar presentation with a quick guidance and practice.

It is always wise to have a most sough after skill in hand to increase employability & cement a position in job industry.

While Microsoft Office is filled with short cuts and methods to create attractive and easy to manage documents, a comprehensive hands-on training can help you to master the hooks and corners of the Microsoft Office package within just 3 days.

Simply follow the step-by-step instructions and learn the art of creating professional business documents easily every time.

With this training you will be able to Create Impressive Proposals, Charts & Presentations to Woo Clients.

View the detailed Course Outline

Companies can apply for SDF FUNDING & Individuals can apply for SkillsFuture Credits to offset the Training Fees.

If you have questions on Funding or need an official quotation/course brochure, please contact me on 9343-2080 or drop us an Email.

Like us on Facebook, Follow us on Instagram and Do Check out our LinkedIn for more updates on the Courses & Grants!

P.S: Don’t forget to check out our Amazing Article on Best Practices For Managing Emails With Microsoft Outlook to Manage Emails like a Pro!

Exciting Microsoft Excel Shortcuts You Never Knew

Top-Exciting-Microsoft-Excel-Shortcuts-You-Never-Knew

Microsoft Excel is one of the most used software at work. People who claim to know Microsoft Excel software mostly are the ones with basic or intermediate knowledge & understanding of Excel. The productivity increases only when we make the most out of the useful software, and gain mastery.

There are many hidden gems and short cuts within Excel, that hardly anyone talks about. I am amazed when people with years of Excel experience tell me they haven’t heard about these. What a waste of time…

‘Let us discuss in this series the ultimate tips in Excel that will make things snappier, and make your co-workers say, “how did you do that??”. They will save a lot of time for you too and improve your productivity.

Tip Number 01 INSERT SERIAL NUMBERS IN A FLASH

What do we when we have to insert Serial Numbers in Excel? We type the number 1 in the cell A1, then 2 in the cell A2, and finally select both the cells & drag the mouse pointer until we get the required serial numbers generated. Right?

But what happens when we need Serial numbers until 100? 200? Or more?

Do we keep dragging? Certainly not!

There is an ultimately easy way in which you can just flash fill the serial numbers to whatever value needed.

Insert Serial Number in a Flash

Here are the steps:

Input Number 1 in the first cell

Step 1 Input number in Cell A1

Select Fill > Series from Editing Ribbon of Home Tab

  1. Home> Fill > Series

Step 02 Select Series from Fill option

  • Select Columns from the Dialog box, give Step & Stop values and Hit OK.

Step 03 Select Column and give stop value

NOTE: If you are looking to Fill Rows instead of columns, just select Rows in the dialog box and follow the same steps.
Bet you didn’t know this trick… Well, now you do.

Tip Number 2 FORGET COPY+PASTE – JUST DRAG & DROP

When we have a set of data in one column & we want it to move to another column. What do we do? Select them all, copy or Hit CTRL C and select the destination column, and paste or hit CTRL V?

Forget the hassle, now select the required data, just Drag & drop to the destination.

Drag and Drop to Copy

Tip Number 3: COPY MULTIPLE VALUES USING THE CLIPBOARD

Working with multiple values? Forget the hassle of copying and pasting one by one.
Use the built in Clipboard feature of Excel.

You can expand the clipboard from the icon lists or use the Win (Windows Key) + V to click on the required values

Copy Multiple values using Clipboard

Tip Number 4: DUPLICATE A SHEET IN JUST ONE-CLICK

Want to copy the whole sheet? Are you selecting and copy pasting?
Or right click, copy, select the sheet, move to bottom?? So many steps for duplicating the sheet?

Now Duplicate a Sheet like a Pro!

Just hold down Ctrl + Drag & Drop the sheet to desired position.

Duplicate sheet by drag and drop

Tip Number 5: UNDO & REDO IN ONE HIT

Undo & Redo would be the most used operations in Excel.
Now do undo and redo with just one click.
Use the buttons on top.

Undo and redo in one click

Tip Number 6 Use the QUICK ACCESS TOOLBAR

Tedious to find the operations that you frequently use?

CHANGE ALL CAPS TO Mixed Case for Next 3 Rows.

CLICK THE DROP DOWN ARROW TO SEE THE OPTIONS
YOU CAN ADD THE FREQUENTLY USED OPTION TO QUICK ACCESS TOOLBAR

EXTRA TIP: YOU CAN ADD ANY OTHER COMMANDS THAT YOU USE FREQUENTLY

Quick Access Toolbar

Hope that helps! Want to learn more exciting tips, tricks & shortcuts and improve your productivity in Microsoft Excel?

If you wish to build your knowledge to have a better Excel Operations knowledge, you must start working on it. You will do well in your career, and get ahead faster, even land that dream job with better skills & competence in Excel.

We at Intellisoft are here to guide you.

Intellisoft Systems offers 2 day extensive workshops on Microsoft Excel.

Simply pick a program – Basic/Intermediate Excel OR Advanced Microsoft Excel

Join us to get more out of Microsoft Excel to make the best use of the software in your day-to-day work!

Top 5 cool Career options that rely on Data Analysis

Data Interpretation & Analysis

What Is Data Analysis? And How Can You Start Learning It Today!

Did you know that Data science and Analysis positions are often the hardest ones for a company to fill?

Thanks to exploding demand for data professionals, there are a ton of open roles and not enough candidates to fill them.

Translation? Data analysis is an exciting field to get into and the career prospects are amazing.

Now, just to clear up a common misconception right off the bat: you don’t need to be a math/computer science/coding whiz to land a job in data analysis.

But do you know that you start a career in data analysis if you have no background in it? All you need is to choose right course and guidance.

Today, let us discuss the Top 5 on demand careers tat rely on Data Analysis.

Top Career options that rely on Data Interpretation and Analysis

Popular Careers That Rely on Data Analysis

One really cool thing about gaining data analysis skills is that they don’t lock you into a single career. Sure, you could become a data analyst and stay there for decades if you love it–but there’s also the freedom to pivot in other directions if you choose.

Businesses in nearly every industry use data analytics to power decisions, gain a competitive advantage, boost sales, win new customers, improve internal operations, maximize profits, etc. This makes data analysis skills useful in many roles.

  1. Data Analyst

  • The basics of data analysis involve retrieving and gathering large volumes of data, organizing it, and turning it into insights businesses can use to make better decisions and reach conclusions.
  • To share their findings with business decision-makers, an analyst (or data visualization specialist) may create charts, graphs, etc.

QUICK FACTS ABOUT DATA ANALYSIS AS A CAREER:

  • You can work in a wide variety of industries like healthcare, finance, marketing, fast food, retail IT, etc. Whatever you are interested in!
  • Average salary: $62,453
  • Demand has exploded for data analysts because we are creating more and more new data every day. For example, Google processes 40,000+ search queries every second on average (3.5M searches each day, 1.2 trillion searches per year).
  • And this continues to climb!
  • Data Analyst ranked #35 in Glassdoor’s 50 Best Jobs in America, 2020

If you are looking to become Data Analyst, check out our 2 days course on Data Interpretation & Analysis.

  1. Business Analyst

  • They identify meaningful patterns in data to drive business decisions, working closely with business VPs and senior managers.
  • Their duties may involve predictions, optimizations, risk management, and so forth.

QUICK FACTS ABOUT BUSINESS ANALYSIS AS A CAREER:

  • A Business Analyst is mostly concerned with the day-to-day operations of a business and how to fine-tune business processes
  • Great if you’re interested in/have a background in business or finance
  • Less science/math based than the traditional data analyst role
  • Average salary: $68,346

Lean to Analyze & Report Data with Power BI like a master in just 2 days at Intellisoft Singapore!

  1. Product Manager

  • Product managers own and guide the success of products from conception to launch. Each stage requires data analytics!
  • You must analyze the market for trends and problems to solve, leverage data to determine how to improve features, and figure out how to make the product even better in subsequent versions.

QUICK FACTS ABOUT PRODUCT MANAGEMENT AS A CAREER:

  • All businesses have products (services count!). This opens a ton of possibilities as far as what industry or type of company you can work in
  • Great for those coming from a customer-facing background as you can better understand users
  • Average salary: $108,992
  1. Digital Marketer

  • Digital marketers must understand consumer habits/motivations, detect changing trends, and track performance to improve ads, social media campaigns, and SEO strategies.

QUICK FACTS ABOUT DIGITAL MARKETING AS A CAREER:

  • Successful digital marketers must rely on data!
  • Whether it’s identifying user demographics, measuring clicks and conversions to determine campaign success, or sifting through historical data to choose high-performing strategies, data is important
  • Great hybrid role for someone coming from a content creation, advertising, or traditional marketing background
  • Average salary: $57,473

Learn Digital Marketing fast in just 2 days at Intellisoft Singapore.

  1. Quantitative Analyst

  • Quantitative analysts (“quants”) are data analysis professionals who work in the financial industry, leveraging data and data models to manage risk, predict changes in the valuation of stock and bonds, and make data-driven investment decisions.

QUICK FACTS ABOUT QUANTITATIVE ANALYSIS AS A CAREER:

  • Great if you love math!
  • Perfect role for someone who can’t decide between tech and finance
  • Usually requires a master’s degree in a related field
  • Average salary: $106,751

Intellisoft presents to you a Data Interpretation & Analysis Workshop that is highly practical, where the participants learn by doing several exercises using Predictive Analytics – Correlation, Regression & Modelling Techniques to Analyze and Interpret data.

We also cover advanced Excel data analysis topics like Data Tables, Using Goal Seek, Performing Scenario Analysis, and Advanced Pivot Table techniques in analyzing data within Excel.

Register Online now to learn The Secrets of Data Analysis With Excel, & Be a Power Ninja Data Analyst!

P.S: If you are already an Excel Expert in Data Analysis, its time to up-skill yourself with Data Analysis using Power BI

What are you using Microsoft Excel for?

excel_2013_chart
Excel Chart
Excel Chart

Most people learn Microsoft Excel by hit and trial. As soon as someone explains, or they figure out how to write a simple formula to add two numbers, they think that they know everything about Microsoft Excel.

Nothing could be far from the truth! There is much more to Microsoft Excel than just adding numbers.

And I have even seen people using a Calculator even when a Microsoft Excel spreadsheet is open.

Right out of the box, Microsoft Excel, whether Excel 2010, Excel 2013 or Excel 2016 can do wonders! Let’s see some examples of what Microsoft Excel can do.

Pivot Tables
Pivot Tables

Basic Things that Microsoft Excel is great to use for are:

  • Creating Tables
  • Finding Duplicates
  • Eliminating Duplicates

Advanced Excel Techniques

  • Using Range Names
  • Formulas and Function like Vlookup, Text Functions, Date Functions
  • Pivot Tables
  • Pivot Charts
  • Macros to automate routine tasks
  • Sharing Worksheets and Workbooks
  • Protecting Worksheet, Workbook, individual Cells

Advanced Analysis Techniques and Data Analysis using Microsoft Excel:

Excel VLookup Sample


Are you using Excel to your advantage, or just using it as a basic calculator?

Cheers,
Vinai Prakash
Intellisoft Systems

Free Tips, Tutorials & Training Grants Info

Learn from expert tips, tricks and resources for Excel, PowerPoint, Photoshop, Python, Power BI, Project Management, IT, Soft Skills & more with our Email Newsletter.
Plus get the latest news on Grants. Join Today!

Found What You Were
Looking For?

Just Tell us...

We're Here To Help You!