Do you often feel stressed out with too much work or too many responsibilities?
Even if you work harder in completing the tasks, it seems that you have more tasks on hand than you have time to do them…
This creates a feeling of overwhelm, and a sense of being out of control.
Living in such stress and confusion is not really necessary or required.
There’s a simple way. The technique is to organize your tasks and use your time effectively to get more things done each day.
It can help you to lower stress levels and improve your productivity both at work and at home.
Time Management Skills take time to develop and will look different for each person. Finding what works best for you and your busy schedule is key here.
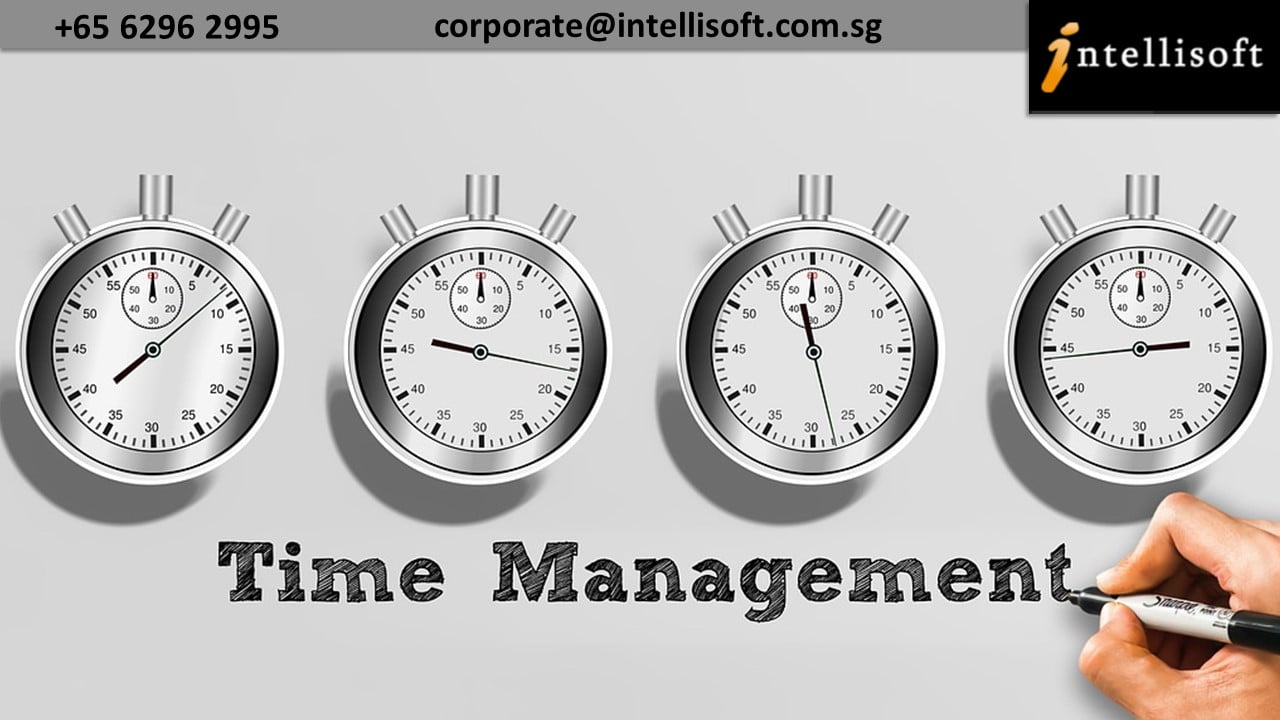
To help you overcome these problems, here are 10 ways to improve your time management skills, get more done in lesser time, and increase your productivity.
-
Prioritize Your Tasks to Stay focused
- Before you start work each day, make a list of things that need your immediate attention. You must be able to distinguish between the urgent and the important.
- Many unimportant tasks can take up much of your valuable time. Often, we actually tend to devote such tasks too much of our energy because they are easier or less stressful to do.
- However, identifying urgent tasks that need to be completed on that day is critical to your productivity.
- Once you know where to put your time & energy first, you will start to get things done in the right order, which would work for you and your schedule too.

-
Create a Schedule
- Carry a Bullet Journal, planner or notebook with you and list all the tasks that come to your mind in it.
- Then as you complete the tasks, you can check them off. Did you know that checking things off as you complete them actually gives you an adrenaline rush, and will give you a sense of accomplishment and keep you motivated to move to the next task.
- Having a simple ‘To Do List’ before the start of the day, prioritize the tasks, and focus on essentials. Make sure that these tasks are attainable, too.
- If there is a big task you need to complete, make that the only thing on your list. You can push the others to the next day.
- If you haven’t read the Bullet Journal Method, or The One Thing, these are excellent books to get started in your journey to save time & get more done. They both have a following of millions on the Internet.
- Just check Instagram, Pinterest or Facebook for multiple communities of people.

-
Delegate Tasks & Involve the Team
- It is quite common for most of us to take on more tasks than what we can complete. This can often result in unnecessary stress and burnout.
- Delegation does not mean you are avoiding your responsibilities. Instead, you are learning proper management of your tasks. Delegating them to key members of your team, according to their level, skill and expertise helps you to get more done.
- Plus, everything may not require only you to do it. Proper delegating will not only free up time for you but will help your team members feel like an integral piece of the work puzzle.

-
Beat Procrastination
- Most people, near their end, feel that they have wasted their lives, and their best ideas were never put to test. Most great works of art would not have been produced if people had procrastinated. Yet, often the fear of failure keeps us form doing what we are destined to do.
- Procrastination is one of the things that has a huge negative effect on productivity. It can result in wasted time and energy.
- Procrastination could be a major problem in both your career and your personal life.
- We tend to procrastinate when we feel bored or overwhelmed. Try to schedule in smaller, fun activities throughout the day to break up the more difficult tasks.
- This will help you to get stared, and get more done. Once the momentum kicks in, you are on a ball.

-
Set up Deadlines
- For whatever task you have at hand, you must set a realistic deadline and stick to it as much as possible.
- Once you set a deadline, it may be helpful to write it on a post it note and put it near your workspace. This will give you a visual cue to keep you on track of your task.
- You can also set a Tomato Timer, which will set a timer for 25 minutes, which is about the time it takes to stay focused and get something worthwhile done.
- Challenge yourself and meet the deadline. You may reward yourself for meeting a difficult challenge. All these will give you a dopamine rush to your brain, and keep you going for long.

-
Avoid Multitasking, Focus on Single-Tasking
- Most of us were taught that multitasking is an efficient way of getting things done, but the truth is that we do better when we focus and concentrate on one thing. Finding your ONE THING is the Key to getting more done, according to Gary Keller & Jay Papasan, the authors of the New York Times bestseller, The One Thing.
- Multi-tasking hampers productivity and should be avoided to improve time management skills. Make use of to-do lists and deadlines to help you stay focused!
- Do one thing at a time, and focus on it only. This way you can do better at what you’re doing. Wait until you finish one before starting another.
- You’ll be surprised by how much more you’re able to get done.

-
Deal With Stress, Actively
- Stress often occurs when we accept more work than we are capable of accomplishing. The result is that our body starts feeling tired, which can affect our productivity.
- The key is to find what works for you when it comes to lowering your stress response.
- If you do not have time for anything else, try a couple of Breathing Techniques.
- These can be done in a few minutes and have been proven to lower stress-inducing hormones. Yoga or Meditation can also help you de-stress.

-
Learn to Say No
- At times, you’ve got to politely refuse to accept additional task, if you think that you’re already overloaded with work. Take a look at your to do list before agreeing to take on extra work.
- Saying No doesn’t come naturally to most of us, but is an essential skill, similar to Delegating, that will help you achieve more.
- Many people worry that saying no will make them look selfish, but the truth is that saying no is one of the best ways to take care of yourself and your time. Treat your time with respect, and don’t let unnecessary activities hog it.
- When you take care of this important activity, you’ll find that you have more energy to devote to the important things, which the people around you will ultimately appreciate.

-
Take Regular Breaks
- Whenever you find yourself feeling tired and stressed, take a short break of about 10 to 15 minutes. Too much stress can take a toll on your body and affect your productivity.
- You can even schedule your break times. It helps you to relax and get back to work with more and renewed energy later.
- If you know a break is coming, you’ll likely be able to overcome boredom or a lack of motivation to push through the task at hand.
- Take a walk, listen to some enlightening or motivating music, or do some quick stretches. The best idea is to take a break from work completely and spend time with your friends and family.

-
Start Early
- Most successful people have one thing in common — they get up early, and start the day way early, as it gives them time to sit, think, and plan their day.
- When you get up early, you are more calm, creative, and clear-headed. As the day progresses, your energy levels start going down, which affects your productivity, motivation, and focus.
- If you’re not a morning person, you can just try waking up thirty minutes earlier than your normal time. You’ll be amazed by how much you can get done in that bit of time.
- If you don’t want to use it to work, use it to do a bit of exercise or eat a healthy breakfast. A bit of Yoga and 20 minutes of silent meditation can help you focus better too.
- This kind of routine will also contribute to your productivity during the day.

Conclusion
When you get clear about your tasks, your priorities, responsibilities and your life, you’ll be more focused and get more done in less time.
Good time management requires a daily practice of prioritizing tasks and organizing them in a way that can save time while achieving more.
It is a personal victory, and a professional one too.
It is time to move out of your comfort zone, and reach your true potential.
Join our Time Management Workshop to learn more ideas & strategies that will surprise you to know much more time you seem to have.
P.S: Do check this out to Write Effective Business Emails.