Are you ready to take your career from good to great?
Enhancing your skill set with a soft skills course in Singapore can be the game-changer you’ve been looking for.
While technical expertise is important, it is often the soft skills that set top performers apart from the rest.
In today’s competitive job market, employers are seeking candidates who not only excel in their field but also possess strong communication, leadership, and problem-solving abilities.
A soft skills course Singapore can equip you with these essential skills and give you a competitive edge.
Singapore, known for its world-class educational institutions, offers a wide range of soft skills courses tailored to various industries and career levels.
Whether you’re a recent graduate, mid-career professional, or seasoned executive, there is a course that can help you sharpen your interpersonal skills and elevate your career prospects.
Investing in a soft skills course not only enhances your employability but also opens doors to leadership opportunities and career advancement.
So, why wait?
Take that leap and embark on your journey to greatness by enrolling in a soft skills course in Singapore today.
The importance of soft skills in the workplace
In today’s fast-paced and interconnected world, technical skills alone are no longer sufficient for success in the workplace.
Employers are increasingly recognizing the value of soft skills in driving team collaboration, customer satisfaction, and overall business success.
Soft skills refer to a set of personal attributes and behaviors that enable individuals to effectively interact and communicate with others.
They include skills such as
- effective communication skills workshops,
- time management skills training
- leadership skills,
- teamwork skills,
- problem-solving skills,
- presentation and public speaking skills,
- adaptability, and
- emotional intelligence.
While hard skills are specific to a particular job or industry, soft skills are transferable and can be applied across various roles and situations.
They are crucial in building strong relationships, resolving conflicts, and fostering a positive work environment.
What are soft skills and why do they matter?

Soft skills are the intangible qualities that enable individuals to navigate the complexities of the modern workplace.
They encompass a wide range of abilities that go beyond technical expertise and are essential for personal and professional success.
Effective communication is one of the most critical soft skills. It involves not only expressing ideas clearly but also listening actively and empathetically.
Strong communication skills enable individuals to convey their thoughts, build rapport, and resolve conflicts effectively.
Leadership is another vital soft skill that sets individuals apart.
A good leader inspires and motivates others, sets clear goals, and guides the team towards achieving them. Leadership skills are crucial for driving innovation, managing change, and creating a positive work culture.
Problem-solving and critical thinking skills are also highly valued in today’s workplace. Being able to analyze complex situations, think creatively, and make informed decisions is essential for overcoming challenges and seizing opportunities.
If you join such a soft skills course Singapore, it will help your career and you immediately.
Intellisoft has several soft skills certification Singapore courses that can get up to 70% WSQ Grant.
Benefits of enhancing your soft skills

Investing in the development of your soft skills can yield numerous benefits for your career and personal growth.
Here are a few reasons why enhancing your soft skills with a certification course in Singapore is worth the effort:
1. Improved Communication: Strong communication skills enable you to express your ideas clearly, build relationships, and collaborate effectively with colleagues and clients.
Clear and concise communication can prevent misunderstandings, enhance productivity, and contribute to a positive work environment.
2. Enhanced Leadership Abilities: Developing your leadership skills can open doors to managerial positions and increase your chances of career advancement.
Effective leaders inspire and motivate their teams, drive innovation, and foster a culture of excellence.
3. Better Problem-Solving: Problem-solving and critical thinking skills are essential for overcoming challenges and finding innovative solutions. By honing these skills, you can become a valuable asset to your organization and contribute to its success.
4. Increased Adaptability: Soft skills such as adaptability and resilience enable you to navigate change and thrive in dynamic work environments. The ability to quickly adapt to new technologies, processes, and market trends is crucial for staying ahead in today’s rapidly evolving world.
5. Enhanced Professional Reputation: By demonstrating strong soft skills, you can build a positive professional reputation. Employers and colleagues will perceive you as reliable, trustworthy, and capable of handling difficult situations with grace and professionalism.
Soft skills in demand in Singapore
 Singapore’s thriving economy and diverse workforce make it a hub of opportunities for professionals from various industries. Several soft skills are particularly in demand in the Singaporean job market. Thus, attending a soft skills course Singapore, and getting certified with a WSQ Course will help you show your competence to potential employers.
1. Communication Skills: Singapore is a multicultural society with a strong emphasis on effective communication. Employers value candidates who can articulate ideas clearly, adapt their communication style to diverse audiences, and build rapport with clients and colleagues. Making an impactful presentation helps you to communicate better in large settings & meetings.
2. Leadership Abilities: As organizations in Singapore strive for growth and innovation, leadership skills are highly sought after. Employers value individuals who can lead teams, drive change, and inspire others to achieve their full potential.
3. Problem-Solving and Critical Thinking: Singapore’s competitive business landscape requires individuals who can analyze complex problems, think critically, and make informed decisions. Employers seek candidates who can contribute fresh perspectives and innovative solutions. Soft Skills like Communication Skills, and Problem Solving Skills are in high demand, according to SkillsFuture Surveys.
4. Adaptability and Resilience: Singapore’s rapidly changing business environment necessitates individuals who can adapt quickly to new technologies, market trends, and organizational changes. Employers value candidates who can thrive in dynamic work environments and embrace change.
The role of a Soft Skills Course in Personal Development
 A soft skills course Singapore can play a crucial role in your personal and professional development. It provides a structured and focused approach to enhancing your soft skills, enabling you to acquire new knowledge, practice essential techniques, and receive feedback from experienced trainers.
Unlike generic self-help books or online resources, a soft skills course offers a tailored curriculum designed to address specific skill gaps and industry requirements. It provides a comprehensive learning experience that combines theoretical knowledge with practical application.
A well-designed soft skills course in Singapore at Intellisoft Systems incorporates
- interactive activities,
- case studies,
- role plays, and
- group discussions
to facilitate active learning and skill development. It allows you to practice new skills in a safe and supportive environment, gaining confidence and proficiency along the way.
In addition to developing specific soft skills, a course can also enhance your self-awareness and emotional intelligence. It helps you understand your own strengths and weaknesses, improve your ability to empathize with others, and navigate social interactions with greater ease.
Choosing the right soft skills course in Singapore

With a plethora of soft skills courses available in Singapore, choosing the right one can seem overwhelming. Here are a few factors to consider when selecting a course that aligns with your needs and goals:
1. Reputation and Accreditation: Look for courses offered by reputable training providers with a proven track record of delivering high-quality programs. Check if the course is accredited or endorsed by recognized industry bodies or educational institutions.
2. Course Content and Structure: Assess the course syllabus to ensure it covers the specific soft skills you want to develop. Consider the teaching methods, duration, and delivery format (in-person, online, or blended) to determine if it suits your learning style and schedule.
3. Trainers and Facilitators: Research the qualifications and experience of the trainers/facilitators delivering the course. Look for professionals who have relevant industry experience and a strong background in training and development.
4. Past Participants’ Feedback: Read testimonials or reach out to past participants to get insights into their experience with the course. Their feedback can provide valuable information about the course’s effectiveness, relevance, and overall value.
5. Cost and ROI: Consider the course fees in relation to the potential benefits and career advancements it can offer. Assess the return on investment (ROI) by evaluating how the skills acquired in the course can contribute to your professional growth and earning potential.
Remember, the right soft skills course can be a transformative experience that propels your career forward. Take the time to research and choose wisely to maximize the value you gain from the course.
Top soft skills courses in Singapore

Singapore offers a wide range of soft skills courses tailored to different industries and career levels. Here are some of the top courses that can help you enhance your skill set and advance your career. Intellisoft is the top choice for soft skills training providers in Singapore.
1. Effective Communication and Interpersonal Skills: This course focuses on improving verbal and written communication skills, active listening, and building rapport with others. It equips participants with the tools to express ideas clearly, resolve conflicts, and collaborate effectively.
2. Leadership and Management Development: Designed for aspiring and current leaders, this course covers topics such as leadership styles, team management, decision-making, and strategic thinking. It aims to develop participants’ ability to lead and inspire others towards achieving organizational goals.
3. Problem-Solving and Critical Thinking: This course enhances participants’ analytical and problem-solving skills, enabling them to think critically, make sound decisions, and implement effective solutions. It covers techniques such as root cause analysis, creative thinking, and decision-making frameworks.
4. Emotional Intelligence and Relationship Building: This course focuses on developing emotional intelligence, self-awareness, and interpersonal skills. It helps participants understand their own emotions and those of others, manage conflicts, and build strong relationships.
5. Adaptability and Change Management: This course equips individuals with the skills to navigate change, embrace uncertainty, and thrive in dynamic work environments. It covers topics such as resilience, agility, and innovation, enabling participants to adapt quickly to new challenges and opportunities.
These are just a few examples of the many soft skills courses available in Singapore. Take the time to explore different options and select the courses that align with your career goals and development needs.
Tips for maximizing the benefits of a soft skills course
Enrolling in a soft skills course is just the first step towards enhancing your skill set. To maximize the benefits and ensure long-term growth, consider implementing the following tips:
1. Set Clear Goals: Before starting the course, define your goals and objectives. What specific skills do you want to develop or improve? How will these skills contribute to your career advancement? Setting clear goals will help you stay focused throughout the course.
2. Actively Engage: Participate actively in the course by asking questions, sharing your experiences, and contributing to discussions. Be open to feedback and constructive criticism from trainers and fellow participants. Engaging actively will enhance your learning experience and foster meaningful connections.
3. Practice and Apply: Take every opportunity to practice the skills you learn during the course. Experiment with new techniques in your daily work or personal life. Reflect on your experiences and identify areas for improvement. Applying the skills consistently will help you internalize them and make them a natural part of your behavior.
4. Seek Feedback: Request feedback from trainers, peers, and colleagues to gauge your progress and identify areas for further development. Act on the feedback received, and continuously seek opportunities to refine your skills. Constructive feedback is invaluable for growth and improvement.
5. Network and Collaborate: Capitalize on the networking opportunities provided during the course. Connect with like-minded professionals, share insights, and build relationships that can support your career growth. Collaborate on projects or initiatives to further develop your teamwork and communication skills.
6. Continued Learning: Soft skills development is an ongoing process. Stay updated with the latest industry trends and practices by reading books, attending webinars, or joining professional associations. Continuously seek opportunities to expand your knowledge and refine your skills.
By implementing these tips, you can ensure that the soft skills course becomes a catalyst for your personal and professional growth, propelling you towards greater success.
How to apply newly acquired soft skills in the workplace
Acquiring new soft skills is only valuable if you can effectively apply them in the workplace. Here are some strategies to help you translate your newly acquired skills into tangible results:
1. Start Small: Begin by applying your newly acquired skills in low-stakes situations. Practice active listening during meetings, provide constructive feedback to colleagues, or take the lead on a small project. Starting small allows you to gain confidence and refine your skills before tackling more significant challenges.
2. Seek Opportunities: Actively seek opportunities to apply your soft skills in your day-to-day work. Volunteer for projects that require collaboration, leadership, or problem-solving. Look for ways to communicate more effectively with stakeholders or resolve conflicts within your team.
3. Reflect and Learn: Regularly reflect on your experiences and assess how your soft skills have contributed to positive outcomes. Identify areas for improvement and seek feedback from colleagues or supervisors. Continuously learn and refine your skills based on these reflections.
4. Be Patient: Developing and applying soft skills takes time and practice. Be patient with yourself and acknowledge that growth is a gradual process. Celebrate small victories and learn from setbacks. With persistence and dedication, you will see the impact of your enhanced soft skills over time.
Conclusion: Taking your career from good to great with soft skills
In today’s highly competitive job market, technical expertise alone is no longer sufficient for career success. Employers are increasingly prioritizing candidates with strong soft skills, such as communication, leadership, and problem-solving abilities.
Enhancing your skill set with a soft skills course in Singapore can provide you with the tools and knowledge to excel in your field. By investing in your personal development, you can unlock new career opportunities, enhance your professional reputation, and become a highly sought-after candidate in the job market.
So, why wait? Take that leap and enroll in a soft skills course in Singapore today. From good to great, your journey towards personal and professional growth starts now.


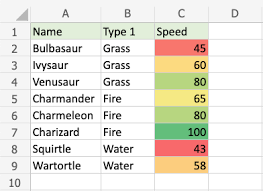 Conditional formatting makes it easy to emphasize important cells or ranges of cells, highlight unusual values, and visualize data by using data bars, color scales, and icon sets. In each newer version of Excel, it includes further more formatting flexibility. Conditional formatting is one module in our