Conditional Formatting in Microsoft Excel For Better Data Visualization

Conditional Formatting in Excel using Color Scales for Data Visualization Training

Improved conditional formatting in Excel For Better Data Visualization

Conditional Formatting in Excel - Sample ScreenshotConditional formatting makes it easy to emphasize important cells or ranges of cells, highlight unusual values, and visualize data by using data bars, color scales, and icon sets. In each newer version of Excel, it includes further more formatting flexibility. Conditional formatting is one module in our https://www.intellisoft.com.sg/advanced-excel-training.html — 3 days hands-on.

Conditional formatting in Excel is a powerful feature that allows you to automatically apply formatting to cells based on specific conditions.

It’s a fantastic tool for visualizing data trends, highlighting important information, and making your spreadsheets more informative and user-friendly.

If you want to join our Excel course in Singapore & improve your skills, we have multiple courses – Basic Excel for Analytics, Advanced Excel Courses in Singapore & VBA Macro Programming Courses.

Here are some of the best ways to use conditional formatting, along with concrete examples:

Color Scales in Excel Conditional Formatting

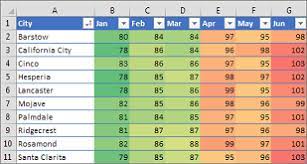
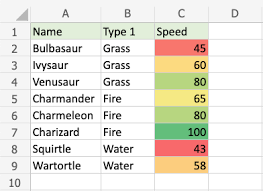
  1. Color Scale for Data Ranges:
    • Use a color scale to visually represent the distribution of data values within a range.
    • Example: Apply a green-to-red color scale to a list of temperature readings to quickly identify hot and cold temperatures.
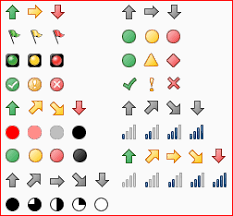
  2. Icon Sets for Comparisons:
    • Apply icon sets to cells to compare values and show trends using icons like arrows or traffic lights.
    • Example: Use upward and downward arrows to indicate whether sales figures have increased or decreased compared to the previous month.
  3. Data Bars for Proportional Data:
    • Use data bars to create horizontal bars within cells to represent the proportional value of each cell compared to others.
    • Example: Apply data bars to visualize the relative sizes of monthly expenses in a budget spreadsheet.
  4. Highlighting Duplicates and Unique Values:
    • Apply conditional formatting to highlight duplicate or unique values in a range of cells.
    • Example: Highlight duplicate names in a list of customers to identify potential data entry errors.
  5. Color-Coded Prioritization:
    • Use conditional formatting to color-code cells based on priority levels, making it easy to identify important tasks or items.
    • Example: Color-code tasks in a to-do list as high, medium, or low priority.
  6. Custom Formulas for Complex Conditions:
    • Create custom formulas for more complex conditions that aren’t covered by built-in formatting rules.
    • Example: Apply conditional formatting to highlight cells with values greater than the average of a range.
  7. Highlighting Dates:
    • Apply conditional formatting to highlight dates that fall within a certain range, such as upcoming deadlines or overdue dates.
    • Example: Use red formatting to highlight dates that are past the current date in a project timeline.
  8. Data Validation Feedback:
    • Use conditional formatting to provide feedback on data validation rules, making it clear why certain entries are invalid.
    • Example: Apply a red border to cells that contain text longer than a specified character limit.
  9. Heat Maps for Data Analysis:
    • Create heat maps by applying conditional formatting to visualize patterns and trends in large datasets.
    • Example: Apply color scales to sales data to quickly identify regions with the highest and lowest sales figures.
  10. Formula-Based Alerts:
    • Use conditional formatting to trigger alerts or notifications based on specific formula-driven conditions.
    • Example: Apply a bold font and red text to cells where inventory levels are below a certain threshold.Icons for use in Conditional Formatting of Data in Excel

Key to effective conditional formatting is to choose formatting options that align with your goals and data presentation needs. By using conditional formatting strategically, you can make your data more visually engaging and facilitate better decision-making.

New icon sets: In Excel, we  can access to more icon sets, including triangles, stars, and boxes. We can also mix and match icons from different sets and more easily hide icons.

For example, we might choose to display icons only for high profit values and remove them for middle and lower values.

More options for data bars: Excel now comes with new formatting options for data bars. You can apply solid fills or borders to the data bar, or set the bar direction from right-to-left instead of left-to-right.

Not only that, data bars for negative values appear on the opposite side of an axis from positive values.

excel trainingIf you would like to learn more about these new features of Microsoft Excel for data analysis and data visualization or would like to attend the Microsoft Excel Training, do contact us at Intellisoft Systems.

If you have any further questions then contact us through email training@intellisoft.com.sg or call at +65 6250-3575!!!

The Best Trainer for Advanced Data Analytics With Excel in Singapore

Mr. Vinai, Prakash the founder of Intellisoft Systems teaches Advanced Excel Techniques, Dashboard Techniques using Excel, Data Interpretation and Analysis Training courses at Intellisoft.

He has trained over 15,000 students in over 18 countries, and regularly conducts Excel Workshops in Singapore, Malaysia, Indonesia, Australia, India, Dubai, Egypt, Zimbabwe, South Africa etc.

Pivot Tables in Microsoft Excel For Fast Data Analysis

Excel Pivot Table Training Singapore

Excel Pivot Tables help us to discover patterns or trends in the data.

Here is a quick tutorial on Pivot Tables in Excel which highlights the new features added in Microsoft Office 365, Office 2019, and Microsoft Office 2016 or earlier versions of Excel.

Master pivot tables hands-on in our 3-day Advanced Excel Training Singapore, with 70% WSQ Funding & it is SkillsFuture claimable.

Earlier we had a look at the Sparklines and Slicers features of Excel so now we will look at the improved pivot table feature of excel.

Excel Pivot Table Training Singapore

Learn Improved Pivot Tables in Excel

PivotTables are now easier to use and more responsive. Key improvements include:

Excel Pivot Table Training
Lesser-Known Features of Microsoft Excel
  • Performance enhancements: In Excel, Multi-threading helps advanced  sorting, data retrieval and filtering in Pivot Tables.
  • Write-back support: In Excel, we can update values in the OLAP PivotTable Values area and then transferred to the Analysis Services cube on the OLAP server. We can use the write-back feature in what-if mode and then roll back the changes when we no longer need them, or we can save the changes. We can use the write-back feature with any OLAP provider that supports the UPDATE CUBE statement.
  • Enhanced filtering: We can use slicers to quickly het the required data in a PivotTable and see which filters are applied without having to open additional menus. In addition, the filter interface includes a handy search box that can help us to find what we need among potentially thousands (or even millions) of items in the PivotTables.
  • Pivot Table labels: We can add labels in a Pivot Table and also replicate them in the Pivot Tables. This will help us to display item captions of nested fields in all rows and columns.
  • PivotChart enhancements: It has made things easy to interact with PivotChart reports. Specifically, it’s easier to get the required data directly in a PivotChart and to reorganize the layout of a PivotChart by adding and deleting fields. Similarly, we can hide all field buttons on the PivotChart report.
  • Show Values As feature: The ‘show values as’ feature includes a number of new, automatic calculations, such as % of Parent Row Total, % of Parent Column Total, % of Parent Total, % Running Total, Rank Smallest to Largest, and Rank Largest to Smallest.

How To Create a Pivot Table in Excel

  1. Drag and drop fields from your data into the “Rows,” “Columns,” “Values,” and “Filters” areas in the PivotTable Field List.
    • Rows: This area represents the rows of your pivot table, often used for categorizing data.
    • Columns: This area represents the columns of your pivot table, creating a hierarchical structure.
    • Values: This area represents the values you want to summarize or calculate, such as sums or averages.
    • Filters: This area allows you to apply filters to your data before generating the pivot table.
  2. Customize Values: You can change the way your values are summarized by clicking on the drop-down arrow next to a field in the “Values” area and selecting a summary function (e.g., Sum, Count, Average).
  3. Apply Filters: If you added fields to the “Filters” area, you can use the filter drop-downs in your pivot table to narrow down the data displayed.
  4. Format and Style: Format and style your pivot table to make it visually appealing and easier to understand. You can use Excel’s formatting tools to adjust fonts, colors, and cell borders.
  5. Refresh Data: If your original data changes, you can refresh the pivot table to update it with the new data. Right-click on the pivot table and choose “Refresh.”
  6. Explore and Analyze: Use your pivot table to explore and analyze your data. You can easily rearrange fields, add or remove them, and experiment with different layouts.

Creating a pivot table might seem a bit complex at first, but once you become familiar with the process, you’ll find it to be a powerful tool for data analysis and reporting in Excel.

Excel Training SingaporeIf you would like to learn more about these new features of Microsoft Excel, or would like to attend the Microsoft Excel Training, do contact us at Intellisoft Systems.

If you have any further questions then contact us through email training@intellisoft.com.sg Systems or call at +65 6250-3575!!!

Your Pivot Table Trainer is Vinai Prakash.

Vinai teaches Advanced Excel Techniques, Dashboard Techniques using Excel, Data Interpretation and Analysis Training courses at Intellisoft.

He has trained over 15,000 students in over 18 countries, and regularly conducts Excel Workshops in Singapore, Malaysia, Indonesia, Australia, India, Dubai, Egypt, Zimbabwe, South Africa etc.

Why Use Pivot Tables in Excel:

Pivot tables are a powerful tool in Excel that offer a range of benefits for data analysis, summarization, and reporting. Here are some examples of why you should use pivot tables and the key advantages they provide:

1. Data Summarization: Pivot tables allow you to quickly summarize and aggregate large datasets. They can help you calculate sums, averages, counts, percentages, and more, without requiring complex formulas.

Example: Summarizing sales data to calculate total revenue, average sales per region, or the number of units sold by product category.

2. Data Analysis: Pivot tables enable you to analyze data from multiple perspectives by arranging fields dynamically. This flexibility allows you to uncover patterns, trends, and insights within your data.

Example: Analyzing website traffic data to determine which pages are most visited, identify traffic sources, and compare user engagement across different time periods.

3. Quick Report Generation: Pivot tables provide a rapid way to generate comprehensive reports from your data. You can customize the layout, apply filters, and instantly update the report as your data changes.

Example: Creating monthly financial reports with detailed breakdowns of expenses, revenues, and profits across various departments or projects.

4. Interactive Dashboards: Pivot tables can be part of interactive dashboards. When combined with slicers and pivot charts, they allow users to dynamically explore data and instantly visualize trends.

Example: Building a sales dashboard where users can filter data by product, region, or time period using slicers and see the results in pivot charts and tables.

5. Easy Data Restructuring: Pivot tables make it easy to reorganize data on the fly. You can quickly change the order of rows and columns to view data from different angles.

Example: Rearranging survey data to view responses based on different demographic categories like age groups, gender, or education levels.

6. Data Cleansing and Filtering: Pivot tables can help you clean and filter your data. You can easily remove duplicates, filter out irrelevant records, and focus on specific subsets of your data.

Example: Identifying and removing duplicate entries from a customer database or filtering out low-performing products from a sales dataset.

Key Advantages of Pivot Tables:

  • Efficiency: Pivot tables allow you to perform complex data analysis tasks quickly, without requiring in-depth knowledge of formulas or programming.
  • Dynamic Exploration: You can easily switch, add, or remove fields to explore data from different angles, helping you uncover hidden insights.
  • Flexibility: Pivot tables accommodate changes in data structure or values, allowing you to update your reports and analysis effortlessly.
  • Compact Presentation: Pivot tables provide summarized results in a compact and easy-to-read format, making it simpler to communicate key findings to stakeholders.
  • Interactivity: By using slicers and pivot charts in conjunction with pivot tables, you can create interactive reports and dashboards that facilitate user-driven analysis.
  • No Data Alteration: Pivot tables do not alter your source data. They create a separate view of your data for analysis purposes, ensuring data integrity.

Pivot tables in Excel are essential for transforming raw data into actionable insights. They offer a range of benefits, including efficient data summarization, interactive analysis, and quick report generation.

Whether you’re working with sales figures, survey responses, financial data, or any other type of dataset, pivot tables can help you make sense of your information and make informed decisions.

From Data Frustration to Data Transformation: A Success Story

Learn to convert data into information into knowledge into wisdom at Intellisoft Systems Singapore

The Challenge of Having Too Much Data & Too Little Time

In today’s data-driven business landscape, the ability to extract meaningful insights from vast amounts of information is crucial. The amount of data that is coming is too fast, and there is hardly any time to analyze it.Learn to convert data into information into knowledge into wisdom at Intellisoft Systems Singapore

This challenge is faced by too many people… But there is light at the end of this black hole of data… See how our heroine, Amanda Lee managed to solve this challenge.

We take you on a captivating journey with Amanda, an employee who faced a daunting challenge: analyzing complex data from SAP.

Her determination, resourcefulness, and expertise in SQL, Excel, and Power BI led her to become a valued data analyst within her organization.

Let’s delve into the Case Study of Amanda and explore the transformative power of these tools, and how Amanda managed to survive the day and thrive…

The SAP Data Conundrum:

Amanda, a dedicated employee known for her analytical skills, was tasked by her manager to analyze data from SAP, the company’s backbone for managing vital business information.

The data was available in multiple places in some standard reports, and some custom reports.Data in multiple silos can be combined with Power BI, SQL, Python. Learn how to do this at Intellisoft Courses in Singapore.

But the manager wanted a perfect report, and it was difficult to make sense of the whole, big picture from multiple sections.

So Amanda was tasked to take this challenge and make it work.

The challenge lay in finding a single report that provided a comprehensive overview of the required data. Undeterred, Amanda set out to conquer this data conundrum.

Exploring Standard Reports:

Amanda embarked on a meticulous exploration of SAP’s standard reports, hoping to find the perfect report or a solution.

She dedicated countless hours to examining various reports, seeking the elusive comprehensive data set.

However, despite her best efforts, none of the reports met the boss’s requirements.

Exporting and Excel Limitations:

Not one to give up easily, Amanda decided to export the data from SAP Reports into Excel, believing it would allow her to manage and analyze the information more effectively.

To her dismay, the exported data turned out to be massive, exceeding the limits of Excel’s capabilities. It became evident that relying solely on Excel would not suffice to solve this complex data puzzle.

Plus, loading multiple huge report files, and other Master data files at the same time caused her computer to crash often.

Excel and the Power of VLOOKUP:

Determined to find a solution, Amanda delved deeper into Excel’s functionalities and discovered the power of VLOOKUP.

She realized that by merging data from multiple sources, she could create a more comprehensive dataset. This process, however, proved to be laborious and error-prone, requiring significant time and effort to align the data properly.

Excel VLookup Sample

Learning VLOOKUP is one thing, and applying it to lookup multiple codes & descriptions from multiple sheets and multiple Excel files was too cumbersome and slow.

Discovering SQL:

Driven by her desire for efficiency, Amanda set out on a quest to find a more robust solution. She began exploring the world of databases and stumbled upon SQL (Structured Query Language).

Recognizing its potential in handling large datasets and performing complex queries, Amanda dedicated to mastering SQL language.

Learn SQL to query any database quickly in Singapore
Introduction to SQL training in Singapore. Learn to query any database with SQL quickly in 2 days at Intellisoft

Learning SQL helped in picking the right data directly from transactional tables in SAP’s Oracle Database by joining several table and writing efficient SQL queries.

The SQL Solution:

Armed with SQL knowledge, Amanda devised a strategy to extract the required data needed from the corporate SAP database.

With a single SQL query, the query effortlessly pulled out the required information, bypassing the arduous process of manual data manipulation.

Amanda’s achievement in harnessing the power of SQL marked a significant turning point in her quest for analytical excellence.

Excel Dashboards and Visualizations:

With the right data finally at her disposal, Amanda exported it back into Excel, now equipped with the necessary insights.

She utilized Excel Dashboards to create various analyses and visualizations, bringing the data to life in a meaningful and impactful way.

The management was astounded by the depth of insights provided by these visualizations, realizing the untapped potential of data analysis.

Introducing Power BI:

The success achieved with Excel Dashboards paved the way for an even more remarkable transformation. Amanda was introduced to Power BI, a powerful business intelligence tool, by the Corporate HQ of the company.

She was spellbound by the dynamic, beautiful, amazing analysis capabilities of Power BI.

She began to migrate the entire solution from Excel to Power BI, creating interactive dashboards and reports that enabled the entire organization to access and explore the latest data analysis  effortlessly, from any device, without waiting for manual data refreshes and month end jobs to complete running.

Becoming the Data Analysis Expert:

Amanda’s expertise in SQL, Excel, and Power BI elevated her to a coveted position within the company.

She became the go-to analyst for senior management, constantly engaging in discussions and providing innovative solutions to analyze and visualize information for the leadership team.

Her journey from an individual contributor to a key player in shaping data-driven decisions exemplified the transformative power of mastering these tools.

Conclusion:

The story of Amanda’s journey from grappling with SAP’s data challenges to becoming an indispensable data analysis expert is a testament to the incredible possibilities offered by SQL, Excel, and Power BI.

By harnessing the power of these tools, individuals can unlock the true potential of data, transform their organizations, and become drivers of analytical excellence in the ever-evolving business landscape.

What Challenge Are You Facing?

Are you facing similar challenges? Or do you have other data challenges?

Do let us know. Our experienced training coordinators can assist you in understanding your data challenges and then guide you with an appropriate course to choose from.

This can help you get started in the right way, and not face the challenges that Amanda faced.

Cheers,

Vinai Prakash, Founder & Principal TrainerIntellisoft Systems

Recommended Reading:

Advanced Excel Course in Singapore

Advanced Excel Course Content

Become Awesome With Advanced Excel Training Course

Advanced Excel course in Singapore is available at Intellisoft Systems.

Excel is a high-end spreadsheet software that is used in business. From simple data entry officers to analysts to managers, everyone loves to use Excel.

This is a higher end training, focusing on the Advanced Level of Microsoft Excel.

If you are new to Excel or have little experience in using Excel, you should first attend our Basic Excel Courses in Singapore. It is more suited to beginner and intermediate users, and will cover the basics of Microsoft Excel thoroughly.

You will then be able to do common tasks in Excel like write some simple functions in your daily work.

At the Advanced level, there are a range of courses available – ones that covers Pivot tables, Advanced Formulas of Excel, or focus on the Data analysis tools & capabilities within Excel to begin with.

Why Should I Learn Advanced Excel Skills?
Do You Know These Advanced Excel Tricks?

Intellisoft offers many advanced Excel training courses. T

o reach the Expert level, you must learn Excel VBA Programming, Excel Dashboarding Techniques, Using Power Query & Power Pivot add-ins of Excel, Advanced Formulas, Advanced Sorting, Advanced Filtering, and the ability to work with large data sets to handle big data.

At the Expert level, you will be looking to pick up business intelligence signals from the processing of data and using business analytics.

So you can see that Advanced Excel is really vast, and will help to take your skills to the next level. It may require you to take a few separate Excel courses to learn the full potential of the spreadsheet application that we all love to use – Excel.

There are numerous advantages of Excel. You must learn the advanced functions and features like pivot tables & macros early to make the most of it in your professional career or for your personal use .

What Advanced Features of Excel are covered in our Excel Training Course in Singapore?

The most important features of MS Excel are covered in depth. The course outlines these features like:

  • Advanced Excel Formulas,
  • Advanced Spreadsheet Functions,
  • Logical Functions
  • Date & Time Functions
  • Database Functions
  • Lookup Functions like VLOOKUP & HLOOKUP
  • Combine Formulas to Create More Powerful Functions
  • Pivot Tables for Summarizing Data Quickly,
  • Recording Basic Macros,
  • Conditional Formatting,
  • Custom Formatting
  • Creating & Using Range Names
  • Combining Data From Multiple Worksheets
  • Combining Data from Multiple Workbooks
  • Sharing Excel Files
  • Data Processing
  • Protecting Excel Workbooks
  • Creating Excel Charts & Customizing them
  • Creating & using Excel Templates
  • And numerous other useful Excel functions

    Do You Know These Advanced Excel Tricks?
    Do You Know These Advanced Excel Tricks?

Who are your Trainers For Advanced Excel Course?

All our trainers are certified Microsoft certified Trainers with a wealth of experience in using and teaching Excel. They are all ACTA certified and love to share their knowledge and application skills to make you an expert in Advanced Excel skills. We go the extra mile to help you master the key essential skills of Excel in a short time.

If you would like to learn from a Microsoft certified trainer with years of experience to learn what works well in the office or for your personal work, you should join our Advanced Microsoft Excel Courses at Intellisoft.

You can be from any type of industry, and you’ll still be able to learn numerous functions and formulas of Microsoft Excel and build your spreadsheet skills at your own pace. Whether you are a basic or advanced user, you will learn a ton of new techniques, shortcuts and tricks in Excel that will elevate your Excel skills to the next level.

Best VBA Course in Singapore
Excel VBA Macro Course in Singapore – Participants learning by writing  Macros themselves

What in Provided for the Advanced Excel Training at our Institute?

We provide you with

  • A laptop loaded with the correct version of Microsoft Excel for your use in our training room.
  • Advanced Excel Exercise Files will be provided too.
  • As part of the course materials provided, a detailed, step-by-step guidebook with Exercise files for Excel will be provided to each participant.
  • The included exercise files have cases from the business world as well as examples of how to use Excel for personal use. With this, your team will become expert excel users who can use the various tools, advanced excel functions and data management capabilities easily.

Pre-Requisites For The Training

In terms of pre-requisites for this Excel course, you don’t need a bachelor degree or any diploma.

Anyone with good PC skills, some previous experience in using Excel, and a keen interest in learning the wide range of advanced functionalities of Excel can join this advanced training workshop.

Excel Dashboard Training Participants
Excel Training Participants at Intellisoft

In a short period of just 2 days, you will be able to

  • use pivot tables,
  • formulas of excel,
  • advanced spreadsheet functions,
  • data analysis tools,
  • charting techniques,
  • conditional formatting,
  • Excel Reports
  • and much more.

You will be able to appreciate the full potential of Excel in everyday use at the office.

Whether you want to make simple or complex spreadsheets, you will have the skills. It does not matter which type of position or the type of industry you are targeting, Excel is used everywhere. So at the completion of this unit, you can call yourself an Advanced User of Excel, and you will have a certificate to prove it too.

Available Grants & Funding For Excel Training For Singaporeans & PRs

You can use SkillsFuture* or WSQ Funding for company sponsored training courses where the course fees is partly sponsored by the Singapore government. The SSG Rules & Guidelines on eligibility apply.

With an affordable price, we can also arrange for corporate training for a group of participants at your company training rooms or you can attend the training at Intellisoft Training rooms too.

Our training facilities in the lab are top notch. We take care of of social distancing & government rules and regulations.

Intellisoft is considered the best Microsoft Excel training centre in Singapore.

Advanced Excel Course Content
Advanced Excel Course Training in Singapore

How To Join Advanced Excel Training Course in Singapore?

Prospective learners can contact our Training center at Fortune Centre and we can send you more precise information about the course. Request for a course brochure or Register for Advanced Excel training now.

You can then browse the outline of our Microsoft Excel Courses and pick the one that suits your needs the most. Our courses are short, practical and to the point. You will enjoy the training and become a better Excel user is no time.

Learn the most powerful spreadsheet program in the world… directly from the Microsoft Experts!

Join the Advanced Excel Course in Singapore at Intellisoft. We are waiting for you…

Cheers,
Vinai Prakash
Founder of Intellisoft Systems

What is Your Next Step After Learning Excel?

What is Your Next Step after Learning Advanced Excel?

What is Your Next Step After Learning Excel?

Wondering what to pursue after learning Excel? Let us find the answer. Before that, let’s first read a quick short story.

Once upon a time, a very strong woodcutter asked for a job in a timber merchant. The pay was good and so were the working conditions. So, the woodcutter was determined to do his best.

His boss gave him an axe and showed him the area where he would work.

The first day, the woodcutter felled 18 trees.

“Congratulations,” the boss said. “Go on that way!”

Motivated by the boss words, the woodcutter tried harder the next day, but he could only bring down 15 trees. However, the third day he tried even harder, but he could only manage 10 trees. Day after day, he finished with fewer trees.

“I must be losing my strength,” the woodcutter thought. He went to the boss and apologized, saying that he is week and could not understand what was going on too.

“When was the last time you sharpened your axe?” the boss asked.

“Sharpen? But I’ve had no time to sharpen my axe. I have been so busy trying to cut trees….”

This story states that equipping yourself shouldn’t ceases & sharpening the tool set & keep you updated is the only way to a long term success.

Now, why are we reading to this story?

Let me jump to the point directly.

The world is fast paced. So, we need to have the required tools ready & sharp for use. 

It is almost impossible to find work that does not require some amount of Excel. Having the right skills for using and applying Excel for Simple or Advanced tasks is a must.

Microsoft Excel is one of the most valuable skill sets that can take you far!

However, most of you already know & use Microsoft Excel quite well. Really glad to know that. Still, sometimes even experienced Excel experts miss out on the best features of Excel that seem to be hidden.

Is it Sufficient to know Excel well to prove yourself in this competitive world?

Are you ready for the Future?

Learning never ceases and you should keep updating you to keep you in par with the emerging industry and not becoming outdated.

You should grab other Skill set after finishing Microsoft Advanced Excel to keep growing in the Job Industry.

AVAILABLE OPTIONS AFTER MASTERING MICROSOFT EXCEL

Let us discuss the variety of options available in front of you to pursue using the Advanced Microsoft Excel Skills that open you up to various career prospects in addition to career growth.

  1. ATTEND SQL WORKSHOP:

I am an Excel Expert. How do I get into Data Analysis?

I am an Analyst. But I always stand at the mercy of IT peers to query my Data!

Are you relating to these situations?

Let’s talk about the first step you can take to resolve this.

Analysis comes into play only after you have the set of relevant information in your hand that are clean as well.

When you yourself can query data from the relational Database system & reorganize, then certainly you are independent, and you can control your own productivity & efficiency.

Learning the right tool to collect & organize your data can be a savior. If you don’t know what is SQL & Why should you learn it, get yourself acquainted first.

Learn SQL to query any databse at Intellisoft Singapore
Learn SQL to query any Database at Intellisoft Singapore

SQL could be the priority as it is an easy to learn, straight-forward programming language. It is a simple but popular program for Data Management.

Administering, updating, maintaining, and manipulating the database is easy with SQL.

With SQL you can – retrieve, analyze and report information quickly and efficiently.

Wondering How to Learn SQL Fast?

Grab SQL Skills today to be an independent analyst otherwise make a new career as Data Analyst, Database Administrator, Data Scientists or even Data Architect at Intellisoft Singapore.

  1. Join Excel VBA (Macro) Course:

I am an Excel expert. Do I only get to learn the skills that are into Data Analysis?

Well definitely not. As we have already discussed Excel is a program that is used in all the fields in which the Data Analysis is just a new popular.

Excel could be enhanced with further skill sets and utilized in various tasks as well.

One such skill set that is highly useful for people into leadership, or managerial position to review the work or report, or even for someone who is into repeating the functions, formulas, or a set of same steps dozens of times every day.

There is a boon to such people – Macros in Excel.

You can write & record macros for simple to complex steps that you accomplish every day. In addition to that, Macro Code runs much faster and save a huge amount of time, which in turn will increase productivity.

After all, you don’t get bored of what you are doing every day.

Learn to Automate repeated Steps with VBA at Intellisoft Singapore

Looking to learn VBA (Macros) faster?

Join an Excel VBA (Macro) training at Intellisoft Singapore today to Learn practical ways to automate tasks & build a better workflow with VBA Macros and automation in your work.

  1. Data Interpretation & Analysis with Excel:

Data Analysis is a cool and exciting career to get into. When you already are aware of the Excel tool kit, now it’s time to learn the Techniques of Analyzing Data with Excel.

Data Analysis is a process of using logic & statistics to answer some of the business questions which consequently leads to decision-making.

You can learn to understand data and forecasting based on different criteria.

Charts & Modelling can be made using the Excel Features.

Correlation & regression techniques can be used to Analyze Data with different variables.

Data Interpretation & Analysis with Excel Training at Intellisoft Singapore

Above all, It is wise to grab the techniques of using the tool effectively, when you are an Excel Expert Already!

Wondering why you should learn Data Analysis? Check out the top 5 Cool Career Options that rely on Data Analysis

Also Join Intellisoft now to Grab Data Analysis Skills fast.

  1. Create Interactive Management Reports & Dashboards with Excel:

A Dashboard is the dynamic reporting technique used in business data reporting.

If you can present a huge amount of critical data in a Visually Appealing, Dynamic & Interactive Chart in Excel, apparently the decisions are made faster & you are the star of the boardroom already!

 Visually Appealing, Dynamic & Interactive Report in Excel
Visually Appealing, Dynamic & Interactive Report with Excel Dashboard at Intellisoft Singapore

Why wasting time, learn Excel Dashboard & report metrics that matter!

Well, I hope that you now have a clear idea of  What can you do after learning Advanced Microsoft Excel!

Take a breath! Make time out of your calendar to learn the essential skills that matter!

Best of Luck!

Cheers,
Lavanya
Like us on Facebook, Follow us on Instagram & LinkedIn for more updates on Courses & Grants.

Are You Microsoft Office Proficient?

Microsoft Office Training in Singapore

Every job seeker would have this word written in their resume Microsoft Office Proficiency.  

What Exactly is Microsoft Office Proficiency?

A Microsoft Office Proficient should be able to create an error-free, beautifully formatted document with header, footer, page number & Page breaks.

In Excel, they should be able to handle a large volume of data, format, sort, filter and create Pivot Tables for better visualization of Data.

In PowerPoint, the ability to make aesthetically appealing stellar presentation with graphics, images, GIFs, Animation is considered good proficiency.

Handling Microsoft Outlook like a pro to manage emails, create separate folders, track tasks, manage calendar, set reminder, marking them complete, and most important, getting things done quickly with these productivity tools.

This should not be overwhelming. It should be easy to do, and management expects everyone to be proficient in Microsoft Office.

It has been years since the Microsoft Skills have become mandatory for every person coming into the workforce – whether administration, data handling, HR or even the Managerial Position.

A research by IDC concludes that Microsoft Office is one of the top three skills desired by any employers next to oral and written communication Skills.

Possessing Microsoft Skills not only merely helpful in typing docs and tabulating number, rather they help us to get more productive, efficient and handle and present data professionally effectively than ever. Microsoft Office is the most effective, accessible, and easy to use software’s.

Lear Microsoft Office Skills at Intellisoft

Microsoft Word:

It has been used by many people as just a notepad or a typing software’s. But in real, it can do wonders in creating professional Documents.

If we can spend some time in learning a bit more than what the Home Tab has, it can considerably reduce the time we spend on making documents.

Word is useful to create better Proposals, Reports, Agenda, Meeting Minutes & more.

Microsoft Excel:

Excel is often used in accounting and finance for its ability to calculate and compute complex numbers. Even non-financial businesses use Excel because of its unbeatable ability to organize data in tables & for updating, organizing, and displaying the data nicely.

It is highly used in administration and managerial level to analyze data quickly and present to management.

It even supports Visual Basic Applications to create macros to automate functions that increase efficiency.

In fact, the Pivot Tables and Dashboards are inevitable when it comes to analysis and reporting. You must up your proficiency in Excel to master these functions.

Microsoft PowerPoint:

Everyone would have made a basic presentation in Schools and workplaces to present the work. But PowerPoint comes handy to make it visually appealing and effective.

Its intelligence in generating different design ideas for the slides is becoming so popular nowadays. Other than just suggestion, it allows you to use the plenty of shapes and icons that are in-built and even allows you to import illustrations and graphics from the internet while working.

In short, anyone can make a stellar presentation with a quick guidance and practice.

It is always wise to have a most sough after skill in hand to increase employability & cement a position in job industry.

While Microsoft Office is filled with short cuts and methods to create attractive and easy to manage documents, a comprehensive hands-on training can help you to master the hooks and corners of the Microsoft Office package within just 3 days.

Simply follow the step-by-step instructions and learn the art of creating professional business documents easily every time.

With this training you will be able to Create Impressive Proposals, Charts & Presentations to Woo Clients.

View the detailed Course Outline

Companies can apply for SDF FUNDING & Individuals can apply for SkillsFuture Credits to offset the Training Fees.

If you have questions on Funding or need an official quotation/course brochure, please contact me on 9343-2080 or drop us an Email.

Like us on Facebook, Follow us on Instagram and Do Check out our LinkedIn for more updates on the Courses & Grants!

P.S: Don’t forget to check out our Amazing Article on Best Practices For Managing Emails With Microsoft Outlook to Manage Emails like a Pro!

Free Tips, Tutorials & Training Grants Info

Learn from expert tips, tricks and resources for Excel, PowerPoint, Photoshop, Python, Power BI, Project Management, IT, Soft Skills & more with our Email Newsletter.
Plus get the latest news on Grants. Join Today!

Found What You Were
Looking For?

Just Tell us...

We're Here To Help You!